
Budget vs Actual Volatility AdvisingBryan Julian
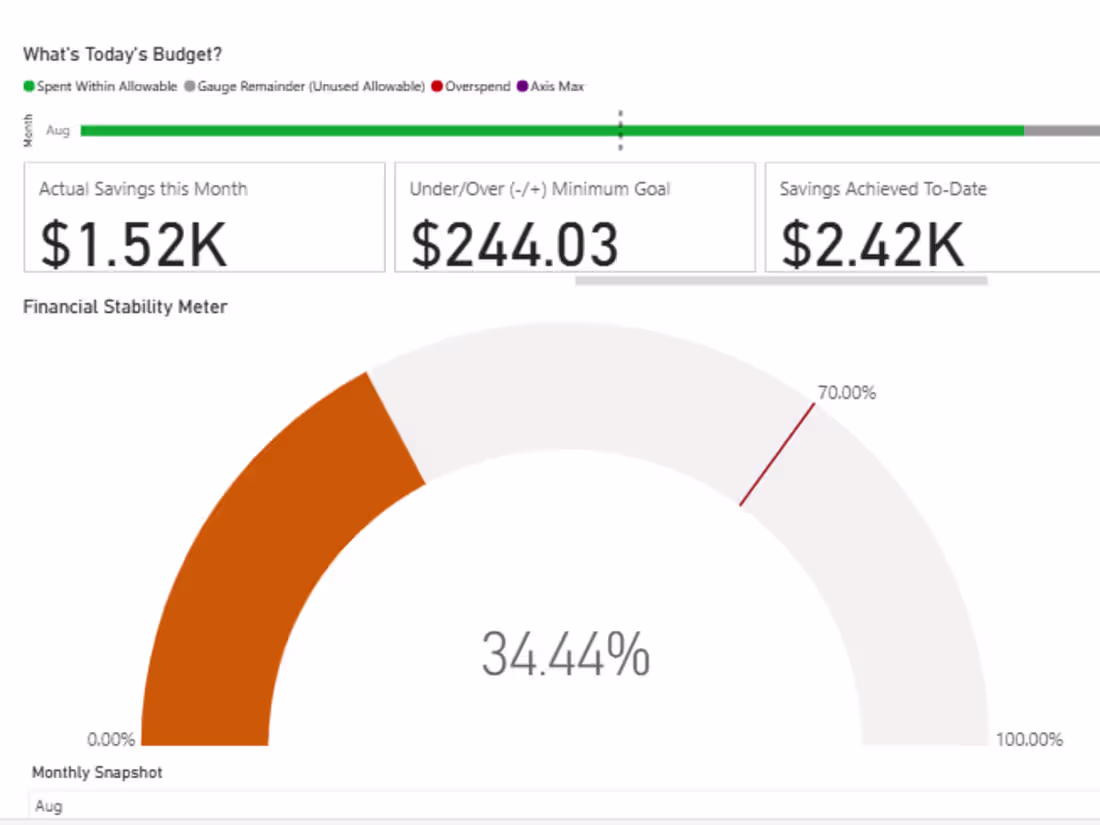
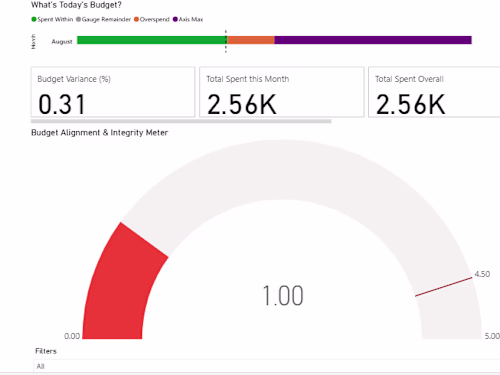
A single view that tells you (1) if you’re within budget, (2) where the pressure is coming from, & (3) whether it’s getting better or worse-- plus the clicks to see the receipts.
Outcomes: fewer surprises, faster close, less manual work, and clearer decisions.
What's included
Fewer budget surprises (detection & speed)
Early-warning lead time: time between first overspend signal and month-end.
Target: ≤ 2 business days from threshold breach to visibility.
Issues surfaced automatically: count of categories with Overspend > 0 shown on Variance page.
Target: 100% of overspends are visible on day they occur.
Lower overspend and tighter variance (impact)
Overspend share of budget (monthly): SUM(Overspend) / SUM(Budget).
Target: ≤ 3–5% by month-end after 1–2 cycles.
% categories within budget: categories with Actual+ ≤ Budget.
Target: ≥ 70% by day-25 of the month (or pro-rata if you use daily budget).
Faster close / less manual effort (efficiency)
Hours saved on BvA prep: reported by finance lead.
Target: 10–20 hrs/month reduction.
Close cycle: days to final BvA sign-off.
Target: 30–50% faster vs baseline month.
Better composition (mix) and forecasting (quality)
Entropy (mix health) normalization (0–1): higher = balanced spend.
Target: raise low-entropy categories by ≥ 0.05–0.10 in 60 days (or defend high entropy if concentration is intentional).
Forecast error (next-month MAPE on expenses): after using Momentum & mix.
Target: ≥ 20% improvement by the 2nd cycle.
Governance & adoption (behavior)
Single source of truth: all BvA views read from the same model.
Target: 0 conflicting numbers across decks/emails post-go-live.
Adoption: weekly active viewers / stakeholders who open the dashboard.
Target: ≥ 80% of the intended audience, and fewer status meetings covering the same ground.
Example work

Contact for pricing
Tags
Google Analytics
Microsoft Excel
Microsoft Power BI
Tableau
Accountant
Data Visualizer
Financial Analyst
Service provided by
Bryan Julian Hyattsville, USA
- 5.00
- Rating
- 1
- Followers
Budget vs Actual Volatility AdvisingBryan Julian
Contact for pricing
Tags
Google Analytics
Microsoft Excel
Microsoft Power BI
Tableau
Accountant
Data Visualizer
Financial Analyst
A single view that tells you (1) if you’re within budget, (2) where the pressure is coming from, & (3) whether it’s getting better or worse-- plus the clicks to see the receipts.
Outcomes: fewer surprises, faster close, less manual work, and clearer decisions.
What's included
Fewer budget surprises (detection & speed)
Early-warning lead time: time between first overspend signal and month-end.
Target: ≤ 2 business days from threshold breach to visibility.
Issues surfaced automatically: count of categories with Overspend > 0 shown on Variance page.
Target: 100% of overspends are visible on day they occur.
Lower overspend and tighter variance (impact)
Overspend share of budget (monthly): SUM(Overspend) / SUM(Budget).
Target: ≤ 3–5% by month-end after 1–2 cycles.
% categories within budget: categories with Actual+ ≤ Budget.
Target: ≥ 70% by day-25 of the month (or pro-rata if you use daily budget).
Faster close / less manual effort (efficiency)
Hours saved on BvA prep: reported by finance lead.
Target: 10–20 hrs/month reduction.
Close cycle: days to final BvA sign-off.
Target: 30–50% faster vs baseline month.
Better composition (mix) and forecasting (quality)
Entropy (mix health) normalization (0–1): higher = balanced spend.
Target: raise low-entropy categories by ≥ 0.05–0.10 in 60 days (or defend high entropy if concentration is intentional).
Forecast error (next-month MAPE on expenses): after using Momentum & mix.
Target: ≥ 20% improvement by the 2nd cycle.
Governance & adoption (behavior)
Single source of truth: all BvA views read from the same model.
Target: 0 conflicting numbers across decks/emails post-go-live.
Adoption: weekly active viewers / stakeholders who open the dashboard.
Target: ≥ 80% of the intended audience, and fewer status meetings covering the same ground.
Example work
Contact for pricing