
Custom Power BI DashboardAaron Boehme
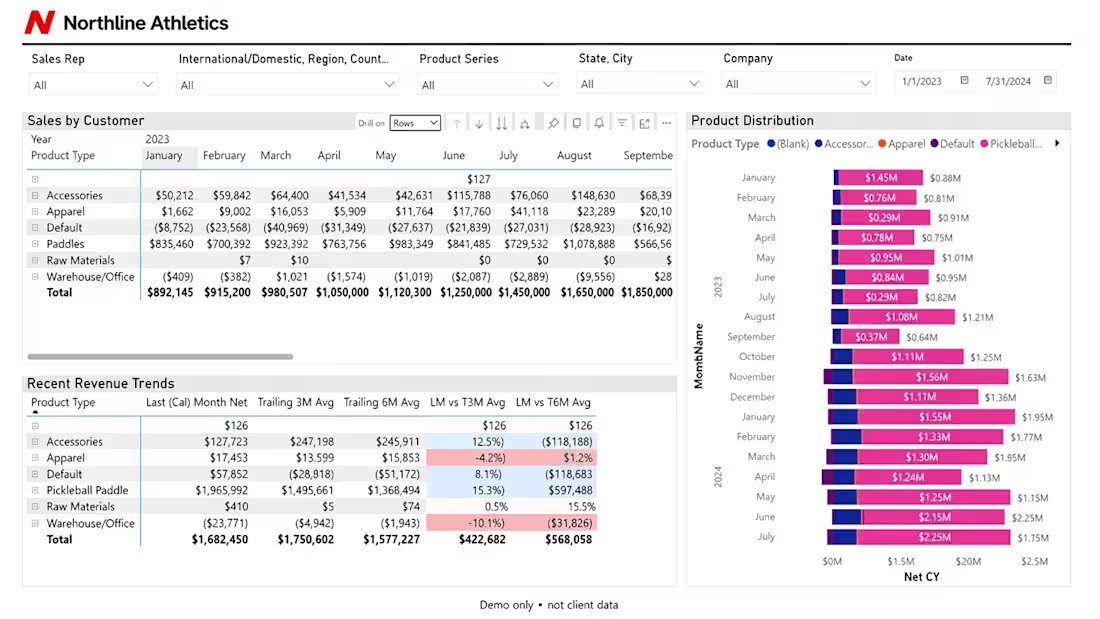
Transform your raw business data into clean, interactive Power BI dashboards that deliver actionable insights at a glance.
Whether you are consolidating scattered Excel spreadsheets, connecting SQL databases, or setting up automated recurring performance reports, I build custom business intelligence solutions tailored to your key operational metrics.
What’s Included:
Data Connection & Modeling: Connecting your raw data sources (Excel, CSV, SQL database, cloud storage) and establishing optimized data models.
Custom Interactive Dashboards: Designing modern, easy-to-read reports complete with KPI cards, time-series charts, breakdown matrices, and custom slicers/filters.
Calculated Metrics (DAX): Building custom metrics to track month-over-month growth, trailing averages, variance analysis, and period comparisons.
Automated Data Refresh: Setting up automated pipeline refreshes so your reports stay updated without manual intervention.
Handoff & Documentation: Video walkthrough (Loom) explaining dashboard navigation, underlying data structures, and instructions on how to adjust parameters.
How It Works:
Scope & Dataset Review: Share your goals, key metrics (KPIs), and raw data structure.
Build & Data Modeling: I clean the data pipeline and construct the dashboard interface.
Review & Refine: You review the working dashboard and request fine-tuning.
Final Handoff: Complete dashboard deployment and video walk-through delivery.
Ready to automate your reporting? Send a message to discuss your project requirements!
Contact for pricing
Duration1 week
Tags
Microsoft Excel

Microsoft Power BI

SQL
Data Analyst
Data
Service provided by
Aaron Boehme Portland, USA
- 2
- Followers
Custom Power BI DashboardAaron Boehme
Contact for pricing
Duration1 week
Tags
Microsoft Excel
Microsoft Power BI
SQL
Data Analyst
Data
Transform your raw business data into clean, interactive Power BI dashboards that deliver actionable insights at a glance.
Whether you are consolidating scattered Excel spreadsheets, connecting SQL databases, or setting up automated recurring performance reports, I build custom business intelligence solutions tailored to your key operational metrics.
What’s Included:
Data Connection & Modeling: Connecting your raw data sources (Excel, CSV, SQL database, cloud storage) and establishing optimized data models.
Custom Interactive Dashboards: Designing modern, easy-to-read reports complete with KPI cards, time-series charts, breakdown matrices, and custom slicers/filters.
Calculated Metrics (DAX): Building custom metrics to track month-over-month growth, trailing averages, variance analysis, and period comparisons.
Automated Data Refresh: Setting up automated pipeline refreshes so your reports stay updated without manual intervention.
Handoff & Documentation: Video walkthrough (Loom) explaining dashboard navigation, underlying data structures, and instructions on how to adjust parameters.
How It Works:
Scope & Dataset Review: Share your goals, key metrics (KPIs), and raw data structure.
Build & Data Modeling: I clean the data pipeline and construct the dashboard interface.
Review & Refine: You review the working dashboard and request fine-tuning.
Final Handoff: Complete dashboard deployment and video walk-through delivery.
Ready to automate your reporting? Send a message to discuss your project requirements!
Contact for pricing