
Data Visualization in Tableau, Excel or Google Sheet

Starting at
$
20
About this service
Summary
Process
FAQs
What kind of data can you work with?
Excel, Google Sheets, CSVs, databases (via SQL), or survey exports — if it’s structured data, I can work with it.
Can you help me choose the best visualization type?
Absolutely — I’ll recommend the most effective chart types for your data and audience.
What if I don’t have clean data?
No problem. I’ll handle cleaning, formatting, and preparing your data for visualization.
What's included
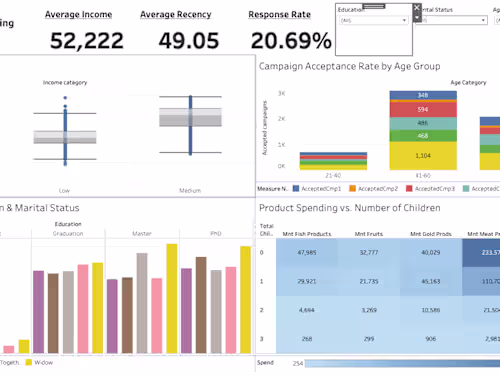
Interactive Dashboard
A fully interactive dashboard built in Tableau, Power BI, Excel, or Google Sheets, customized to visualize your KPIs, trends, and insights clearly.
Data Cleaning & Preparation
I'll clean and format raw data (Excel, CSV, Google Sheets, etc.) to ensure it's analysis-ready, including removing duplicates, fixing formatting, and standardizing entries.
Summary Report or Insight Sheet
A concise summary of key findings from the data, presented in a clear, non-technical format, with visualizations and brief takeaways to guide decisions.
Example projects


Duration
2 days
Skills and tools
Data Analyst
Data Scraper
Data Visualizer

Google Sheets

Microsoft Excel

Tableau