
Data visualizationsTaylor Phillips
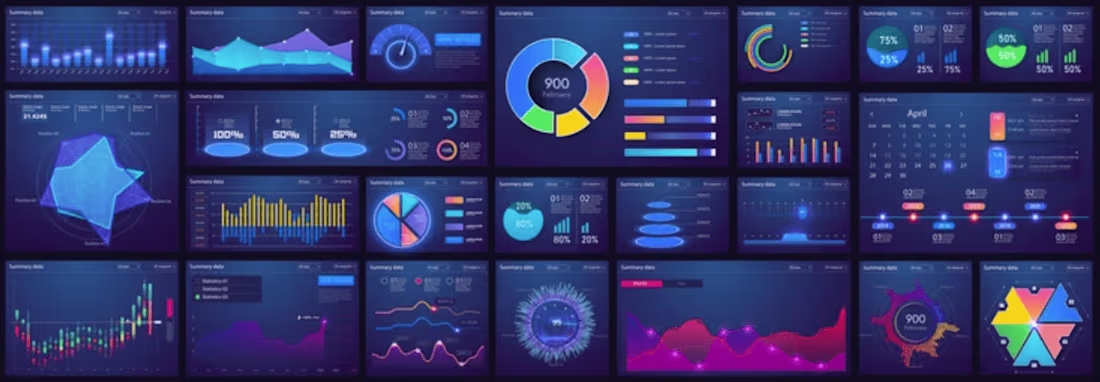
For admin/manager user, it's normal to add Dashboard for analytics purpose
It will include a lot of Tables and Charts.
I can build the Dashboard using D3.js, Chart.js, Cytoscape.js and etc.
What's included
Data visualizations
data visualizations such as charts, graphs, maps, and interactive applications.
Taylor's other services


Contact for pricing
Tags
D3.js
React
Frontend Engineer
Service provided by
Taylor Phillips Pittsburgh, USA
Data visualizationsTaylor Phillips
Contact for pricing
Tags
D3.js
React
Frontend Engineer
For admin/manager user, it's normal to add Dashboard for analytics purpose
It will include a lot of Tables and Charts.
I can build the Dashboard using D3.js, Chart.js, Cytoscape.js and etc.
What's included
Data visualizations
data visualizations such as charts, graphs, maps, and interactive applications.
Taylor's other services
Contact for pricing