
Interactive Data Dashboard Design & DevelopmentVenkata Anirudh Parakala
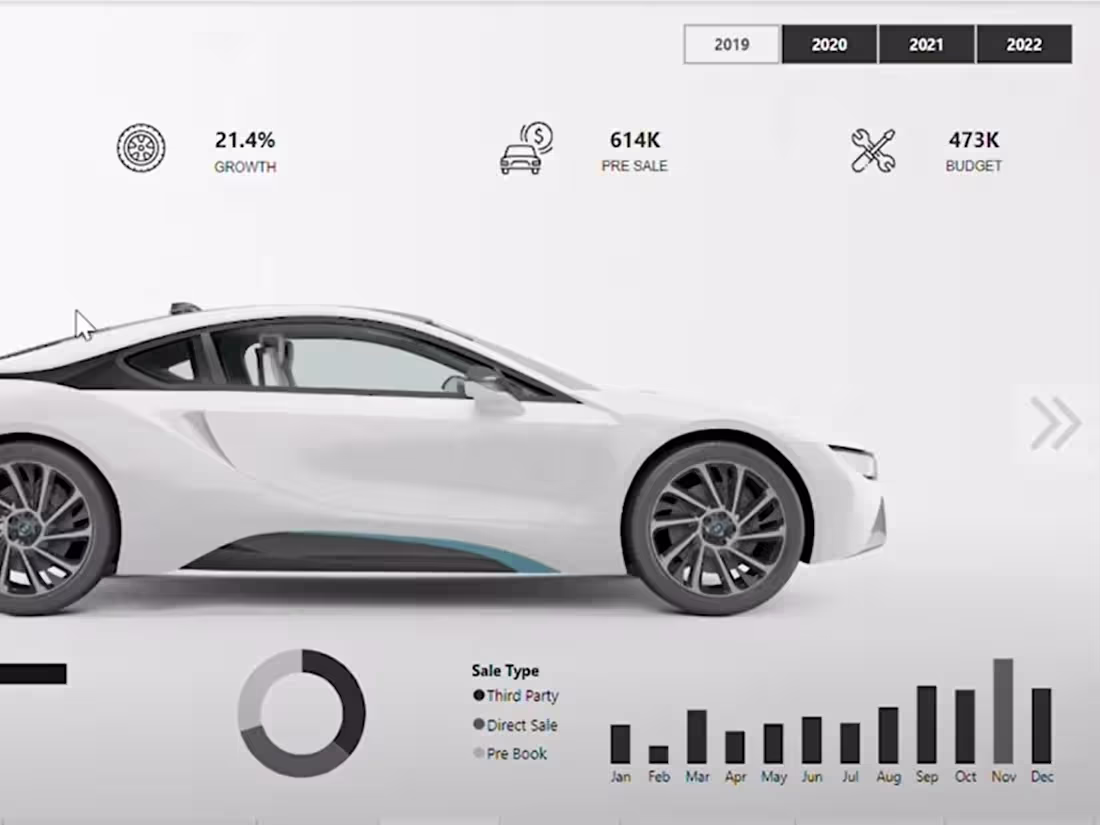
I create interactive, custom dashboards that transform complex data into clear, actionable insights. Using tools like Power BI, Tableau, and Looker Studio, I design visually engaging and user-friendly interfaces tailored to your KPIs and workflows. My focus on both aesthetics and data accuracy ensures decision-makers get the right information, fast.
What's included
Custom Interactive Business Dashboard
An interactive, visually engaging dashboard built in tools like Power BI, Tableau, or Alteryx. Designed to track KPIs, visualize trends, and provide actionable insights, tailored to your data and business goals. Includes clean layout, user-friendly navigation, and data refresh setup.
FAQs
Venkata Anirudh's other services


Starting at$35 /hr
Tags
Alteryx
Microsoft Excel
Microsoft Power BI
Python
Tableau
Business Analyst
Data Analyst
Data Visualizer
Service provided by
Venkata Anirudh Parakala Fort Lauderdale, USA
- 1
- Followers
Interactive Data Dashboard Design & DevelopmentVenkata Anirudh Parakala
Starting at$35 /hr
Tags
Alteryx
Microsoft Excel
Microsoft Power BI
Python
Tableau
Business Analyst
Data Analyst
Data Visualizer
I create interactive, custom dashboards that transform complex data into clear, actionable insights. Using tools like Power BI, Tableau, and Looker Studio, I design visually engaging and user-friendly interfaces tailored to your KPIs and workflows. My focus on both aesthetics and data accuracy ensures decision-makers get the right information, fast.
What's included
Custom Interactive Business Dashboard
An interactive, visually engaging dashboard built in tools like Power BI, Tableau, or Alteryx. Designed to track KPIs, visualize trends, and provide actionable insights, tailored to your data and business goals. Includes clean layout, user-friendly navigation, and data refresh setup.
FAQs
Venkata Anirudh's other services
$35 /hr