
Interactive Excel Dashboard Reports for Data-Driven DecisionsAdewale Adeyemi
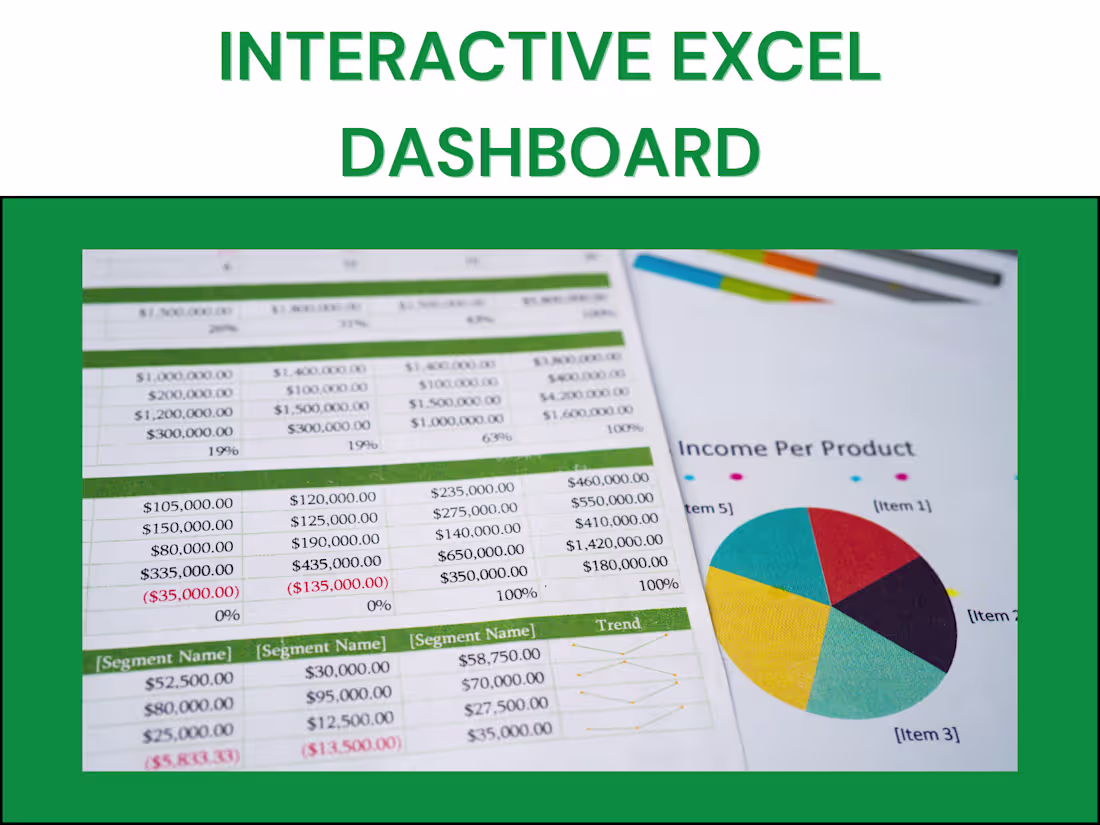
Struggling with messy data? Need a powerful, interactive Excel dashboard to make data-driven decisions? I've got you covered!
Whether you're tracking sales, performance, or KPIs, I design clean, automated dashboards that make complex data easy to understand.
What sets me apart is my focus on usability and clarity, ensuring your reports not only look great but also help you make smarter decisions.
Service Features:
Advanced Excel Dashboards: Custom, interactive, and dynamic
Data Cleansing & Mapping: Clean, structure, and organize your data
Data Analysis & Statistical Insights: Identify trends and patterns
Excel Report Automation: Save time with automated reporting
Power Query & Power Pivot: Advanced data modelling and processing
Pivot Tables & Charts: Visualize key metrics effectively
Data Structure Consultancy: Optimize and streamline your data
ANY other Excel-related task: Tailored to your specific needs
Check FAQs for more details!
Ready to get started? Send me a message for project discussion!
What's included
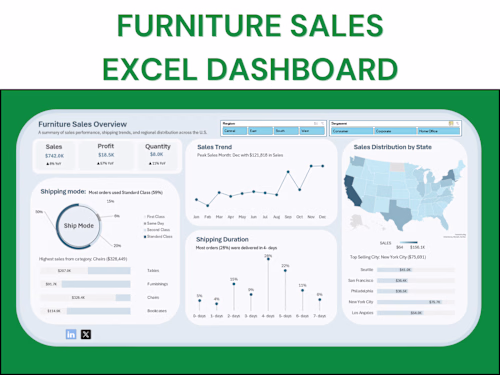
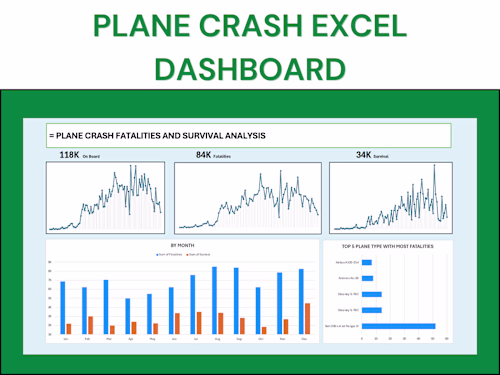
Custom Excel Dashboard Design
Design of a personalized Excel dashboard that presents your data using dynamic charts, graphs, and KPIs based on your specific needs.
Interactive Filters and Controls
Inclusion of slicers, drop-down menus, and other interactive tools to filter and explore your data in real time.
Automated Data Integration
Setup of automated data connections using Excel tables, linked sheets, or external sources to keep your dashboard up to date with minimal effort.
Delivery with Walkthrough Guide
Final delivery of your dashboard with a step-by-step guide or short video explaining how to use, update, and present your report.
FAQs
Starting at$30 /hr
Tags
Microsoft Excel
Data Analyst
Data Modelling Analyst
Service provided by
Adewale Adeyemi Osogbo, Nigeria
Interactive Excel Dashboard Reports for Data-Driven DecisionsAdewale Adeyemi
Struggling with messy data? Need a powerful, interactive Excel dashboard to make data-driven decisions? I've got you covered!
Whether you're tracking sales, performance, or KPIs, I design clean, automated dashboards that make complex data easy to understand.
What sets me apart is my focus on usability and clarity, ensuring your reports not only look great but also help you make smarter decisions.
Service Features:
Advanced Excel Dashboards: Custom, interactive, and dynamic
Data Cleansing & Mapping: Clean, structure, and organize your data
Data Analysis & Statistical Insights: Identify trends and patterns
Excel Report Automation: Save time with automated reporting
Power Query & Power Pivot: Advanced data modelling and processing
Pivot Tables & Charts: Visualize key metrics effectively
Data Structure Consultancy: Optimize and streamline your data
ANY other Excel-related task: Tailored to your specific needs
Check FAQs for more details!
Ready to get started? Send me a message for project discussion!
What's included
Custom Excel Dashboard Design
Design of a personalized Excel dashboard that presents your data using dynamic charts, graphs, and KPIs based on your specific needs.
Interactive Filters and Controls
Inclusion of slicers, drop-down menus, and other interactive tools to filter and explore your data in real time.
Automated Data Integration
Setup of automated data connections using Excel tables, linked sheets, or external sources to keep your dashboard up to date with minimal effort.
Delivery with Walkthrough Guide
Final delivery of your dashboard with a step-by-step guide or short video explaining how to use, update, and present your report.
FAQs
$30 /hr