
Web App Dashboard DesignKelechi Iwuagwu
A well-designed dashboard enhances usability and decision-making by presenting data in an intuitive and visually engaging manner. My dashboard designs focus on usability, aesthetics, and efficiency.
What's included
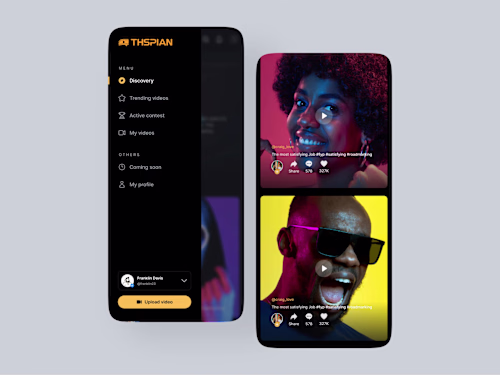
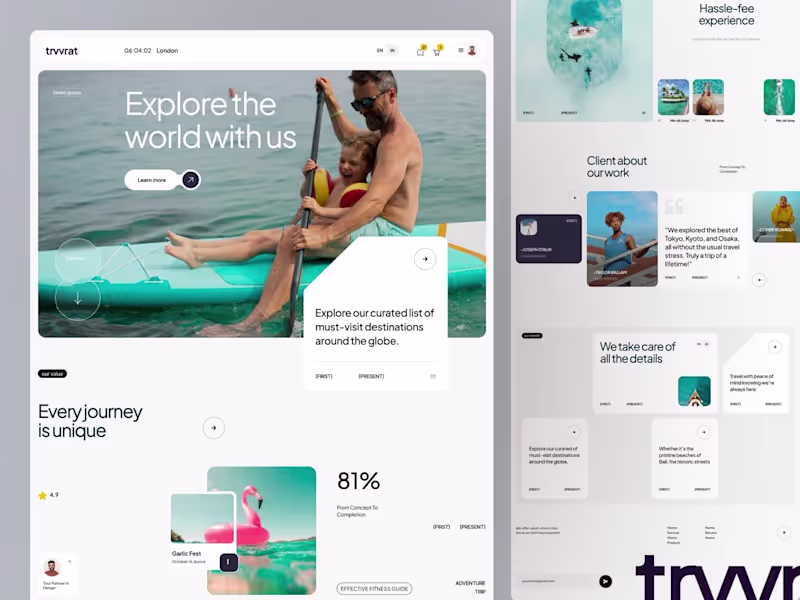
User-Friendly, Intuitive Interface Design
The dashboard will be designed with a clean and structured layout, allowing users to navigate easily and access key features without confusion.
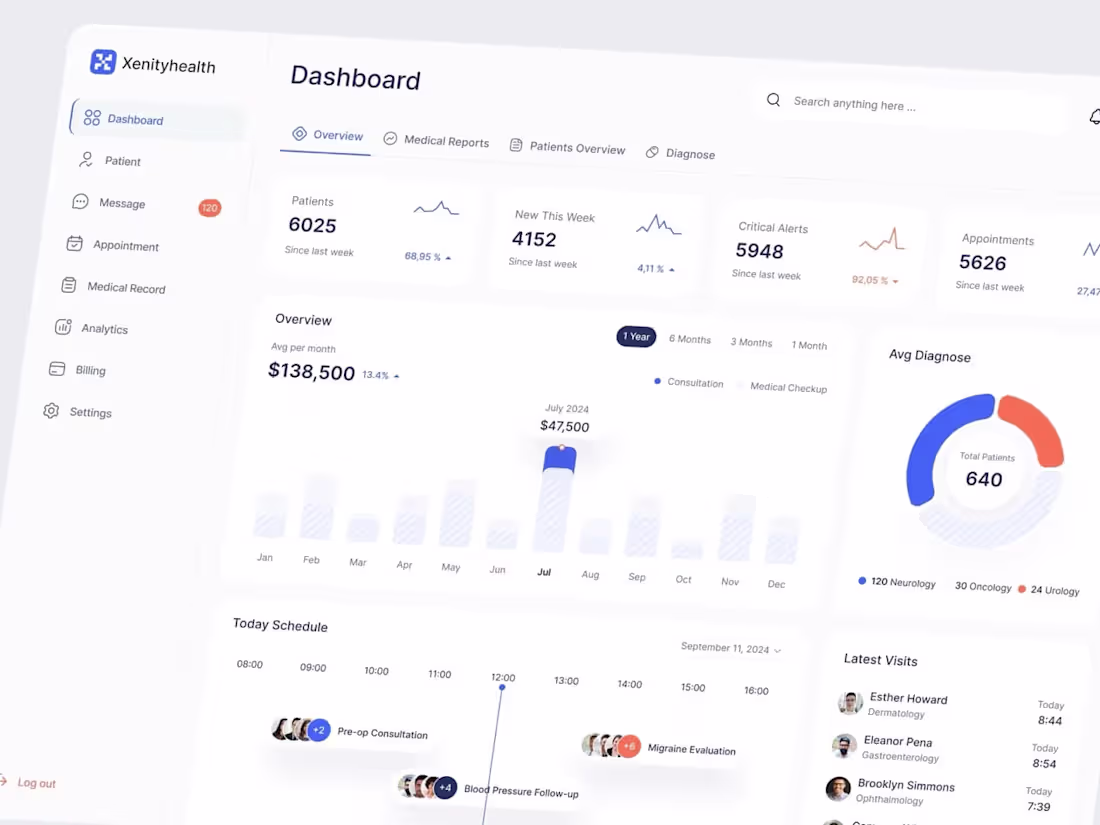
Dashboard Layouts Optimized for Data Visualization
A well-designed dashboard helps users quickly understand and analyze data through charts, tables, and graphs.
Interactive Charts, Graphs, and Analytics Widgets
I integrate visually appealing and interactive components that allow users to view trends and make data-driven decisions.
Design Systems with Reusable UI Components
A design system ensures consistency across different sections of the dashboard and allows for easy future updates or expansions.
Developer-Ready Figma or Adobe XD Files with Annotations
Well-structured design files with clear annotations and guidelines make the development process smooth and efficient.
Example work

Kelechi's other services
Starting at$1,000
Duration1 week
Tags
Figma
Node.js
Ruby
Frontend Engineer
UI Designer
Service provided by
Kelechi Iwuagwu Lagos, Nigeria
Web App Dashboard DesignKelechi Iwuagwu
A well-designed dashboard enhances usability and decision-making by presenting data in an intuitive and visually engaging manner. My dashboard designs focus on usability, aesthetics, and efficiency.
What's included
User-Friendly, Intuitive Interface Design
The dashboard will be designed with a clean and structured layout, allowing users to navigate easily and access key features without confusion.
Dashboard Layouts Optimized for Data Visualization
A well-designed dashboard helps users quickly understand and analyze data through charts, tables, and graphs.
Interactive Charts, Graphs, and Analytics Widgets
I integrate visually appealing and interactive components that allow users to view trends and make data-driven decisions.
Design Systems with Reusable UI Components
A design system ensures consistency across different sections of the dashboard and allows for easy future updates or expansions.
Developer-Ready Figma or Adobe XD Files with Annotations
Well-structured design files with clear annotations and guidelines make the development process smooth and efficient.
Example work
Kelechi's other services
$1,000