
Interactive Data Dashboards with PythonKyde Khumalo
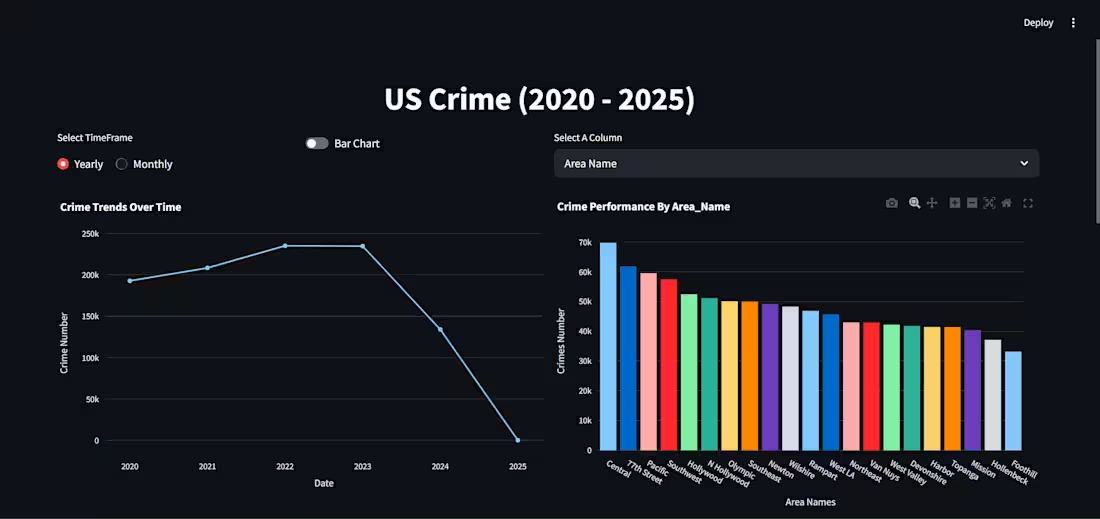
I build interactive dashboards in Python with Streamlit and Plotly. That includes trading performance dashboards, sales and KPI tracking, or any dataset you want to explore visually. Dashboards include filters, charts, and summary metrics, and can connect to CSV, Excel, SQL databases, or live data. Delivery includes the full source code and deployment instructions.
FAQs
Kyde's other services
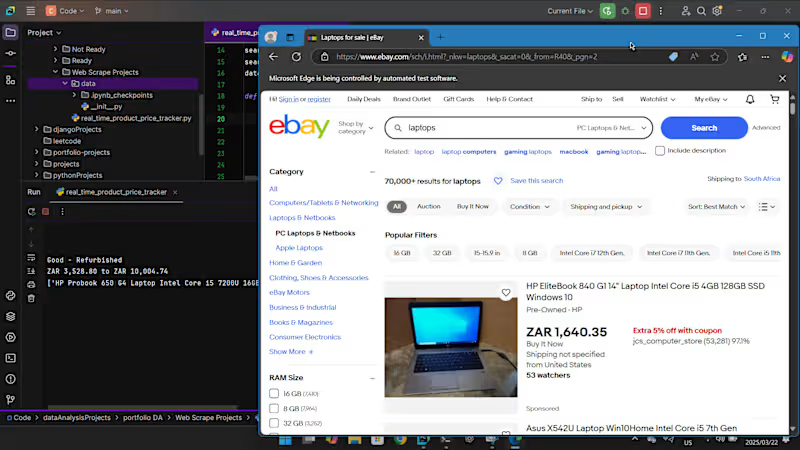
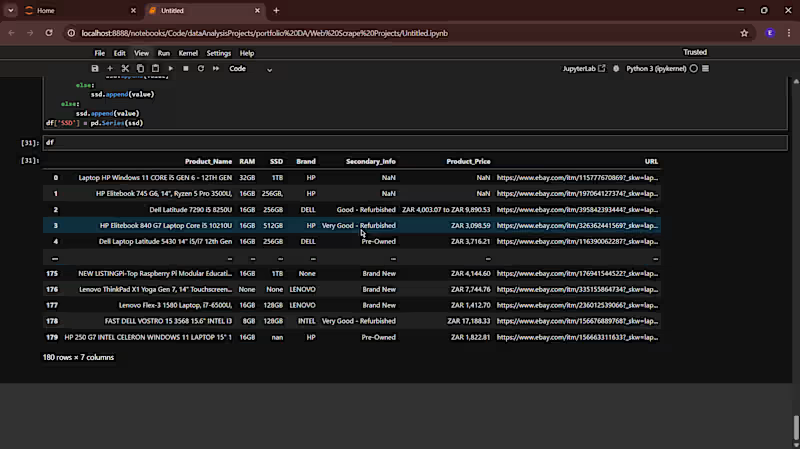
Starting at$150
Duration7 days
Tags
Plotly
Python

Dashboard
Data Visualizer
Streamlite
Service provided by
Kyde Khumalo Durban, South Africa
- 1
- Followers
Interactive Data Dashboards with PythonKyde Khumalo
Starting at$150
Duration7 days
Tags
Plotly
Python
Dashboard
Data Visualizer
Streamlite
I build interactive dashboards in Python with Streamlit and Plotly. That includes trading performance dashboards, sales and KPI tracking, or any dataset you want to explore visually. Dashboards include filters, charts, and summary metrics, and can connect to CSV, Excel, SQL databases, or live data. Delivery includes the full source code and deployment instructions.
FAQs
Kyde's other services
$150