
Data VisualizationsFrancoise Lloyd-Wynter
Clear visual insights from your data
Actionable data, beautifully visualized
Data visuals that drive understanding
Insights turned into clear visuals
What's included
Core Deliverables
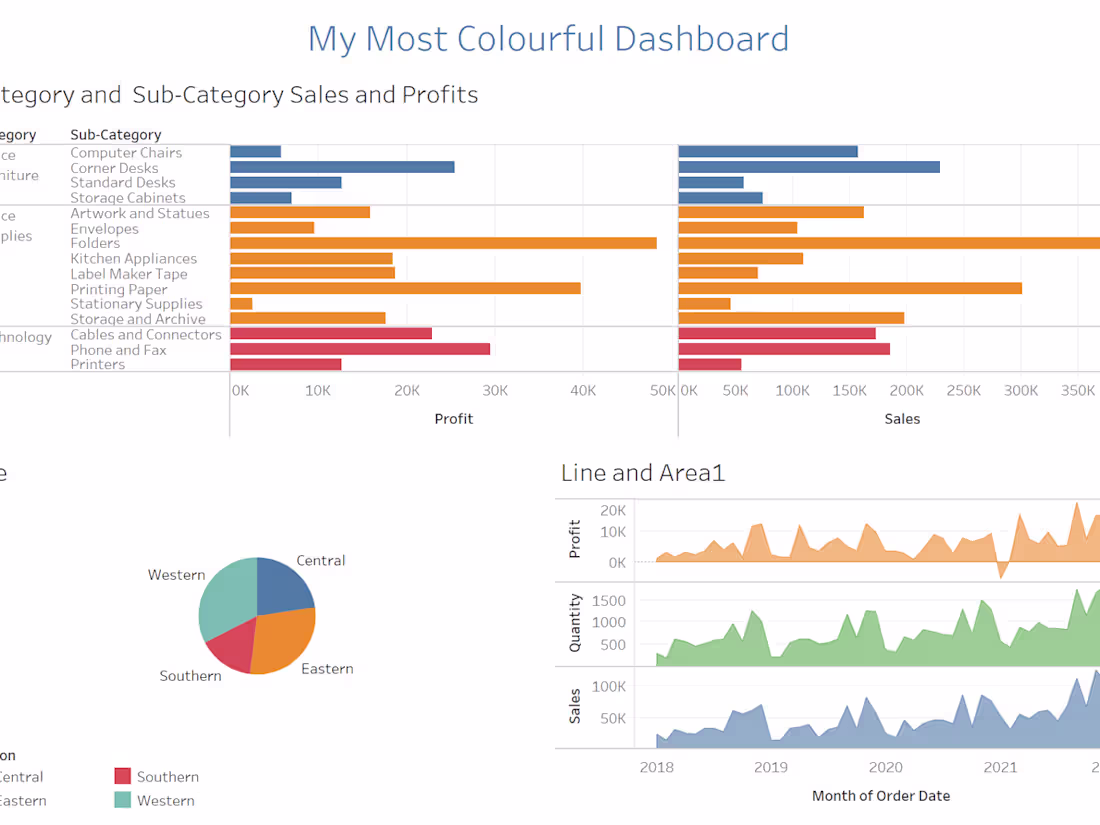
Interactive dashboards (web-based or BI tools)
Static charts & graphs (PNG, SVG, PDF)
Infographics (presentation-ready or web-ready)
Data storytelling visuals (narrative flow with annotations)
Reports with embedded visuals
Data Handling
Cleaned & structured datasets
Data transformation logic (documented calculations)
Source attribution & data notes
Assumptions & limitations summary
Tools & Formats
BI dashboards (Tableau etc.)
Spreadsheet-based visuals (Excel / Google Sheets)
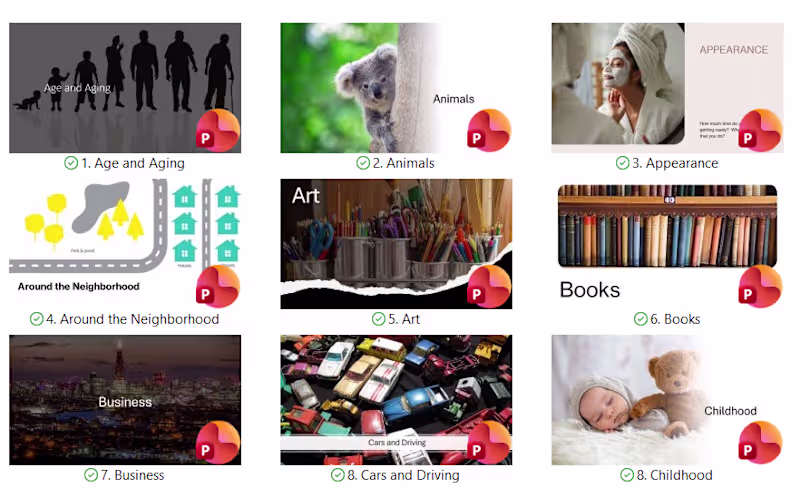
Presentation decks (Slides / PowerPoint)
Francoise's other services

Starting at$40 /hr
Tags
Microsoft Excel
Microsoft PowerPoint
SAP
SQL
Tableau
Business Analyst
Data Analyst
Data Visualizer
Service provided by
Francoise Lloyd-Wynter proLynnwood, USA
- 2
- Followers
Data VisualizationsFrancoise Lloyd-Wynter
Starting at$40 /hr
Tags
Microsoft Excel
Microsoft PowerPoint
SAP
SQL
Tableau
Business Analyst
Data Analyst
Data Visualizer
Clear visual insights from your data
Actionable data, beautifully visualized
Data visuals that drive understanding
Insights turned into clear visuals
What's included
Core Deliverables
Interactive dashboards (web-based or BI tools)
Static charts & graphs (PNG, SVG, PDF)
Infographics (presentation-ready or web-ready)
Data storytelling visuals (narrative flow with annotations)
Reports with embedded visuals
Data Handling
Cleaned & structured datasets
Data transformation logic (documented calculations)
Source attribution & data notes
Assumptions & limitations summary
Tools & Formats
BI dashboards (Tableau etc.)
Spreadsheet-based visuals (Excel / Google Sheets)
Presentation decks (Slides / PowerPoint)
Francoise's other services
$40 /hr