
Data Visualization: Turn Numbers into Stories, Inspire DecisionsEvgeniy Poddubniy
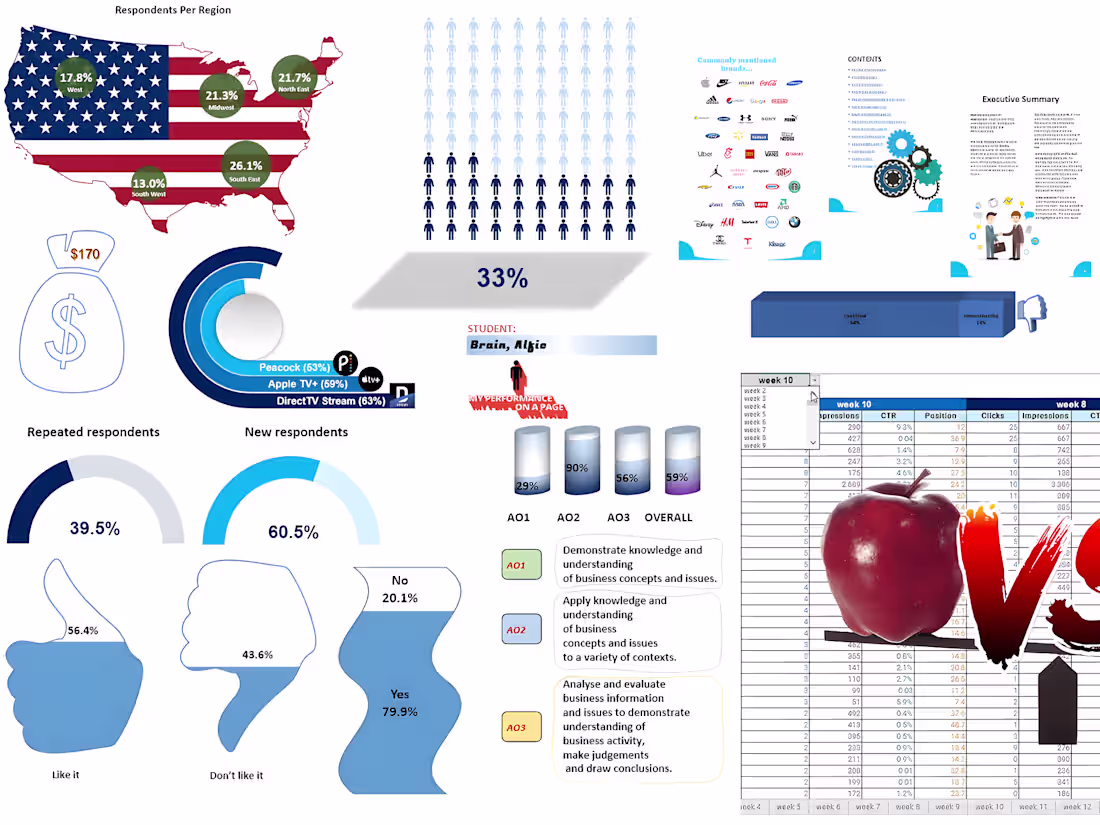
I turn raw data into clean, interactive dashboards that make sense at a glance. My specialty is crafting elegant visuals in Excel and Google Sheets that reveal trends, insights, and opportunities hidden in your numbers.
What's included
Data Cleaning & Analysis
I’ll transform your raw data into a structured, accurate dataset ready for visualization.
This includes removing duplicates, fixing inconsistencies, and performing key calculations, summaries, and trend analyses.
You’ll receive a clean, documented sheet + summary of findings.
Format: Excel / Google Sheets
Includes: 1 dataset processed + analysis sheet + insights summary
Custom Charts & Visualizations
I’ll design clear, insightful charts (bar, line, pie, combo, dynamic, etc.) that turn your data into easy-to-read visuals.
Each chart will be customized to match your dataset, brand colors, and reporting goals.
Format: Excel (.xlsx) or Google Sheets
Includes: up to 10 customized charts + 1 revision
Final Dashboard / Report Design
I’ll create a polished, user-friendly dashboard or report layout that brings together your visuals and metrics into one interactive view.
Perfect for management reporting or client presentations.
Format: Excel (interactive dashboard) or Google Sheets (shared view)
Includes: 1 full dashboard + 2 revisions
Contact for pricing
Tags
Google Sheets
Microsoft Excel
Data Analyst
Data Scientist
Data Visualizer
Service provided by
Evgeniy Poddubniy Kharkiv, Ukraine
- 1
- Followers
Data Visualization: Turn Numbers into Stories, Inspire DecisionsEvgeniy Poddubniy
Contact for pricing
Tags
Google Sheets
Microsoft Excel
Data Analyst
Data Scientist
Data Visualizer
I turn raw data into clean, interactive dashboards that make sense at a glance. My specialty is crafting elegant visuals in Excel and Google Sheets that reveal trends, insights, and opportunities hidden in your numbers.
What's included
Data Cleaning & Analysis
I’ll transform your raw data into a structured, accurate dataset ready for visualization.
This includes removing duplicates, fixing inconsistencies, and performing key calculations, summaries, and trend analyses.
You’ll receive a clean, documented sheet + summary of findings.
Format: Excel / Google Sheets
Includes: 1 dataset processed + analysis sheet + insights summary
Custom Charts & Visualizations
I’ll design clear, insightful charts (bar, line, pie, combo, dynamic, etc.) that turn your data into easy-to-read visuals.
Each chart will be customized to match your dataset, brand colors, and reporting goals.
Format: Excel (.xlsx) or Google Sheets
Includes: up to 10 customized charts + 1 revision
Final Dashboard / Report Design
I’ll create a polished, user-friendly dashboard or report layout that brings together your visuals and metrics into one interactive view.
Perfect for management reporting or client presentations.
Format: Excel (interactive dashboard) or Google Sheets (shared view)
Includes: 1 full dashboard + 2 revisions
Contact for pricing