
Data Analytics & DashboardsGaurav Acharya
What I Offer
I specialize in custom data analytics and interactive dashboard solutions, transforming raw data into actionable insights that help businesses track performance, monitor KPIs, and make informed decisions.
My Focus
Designing clean, user-friendly, and responsive dashboards
Automated data updates and real-time analytics
Interactive charts, graphs, filters, and reporting
What Makes Me Unique
I combine advanced analytics techniques with intuitive design and software engineering best practices, delivering dashboards that are not only visually appealing but also reliable, scalable, and optimized for decision-making.
What's included
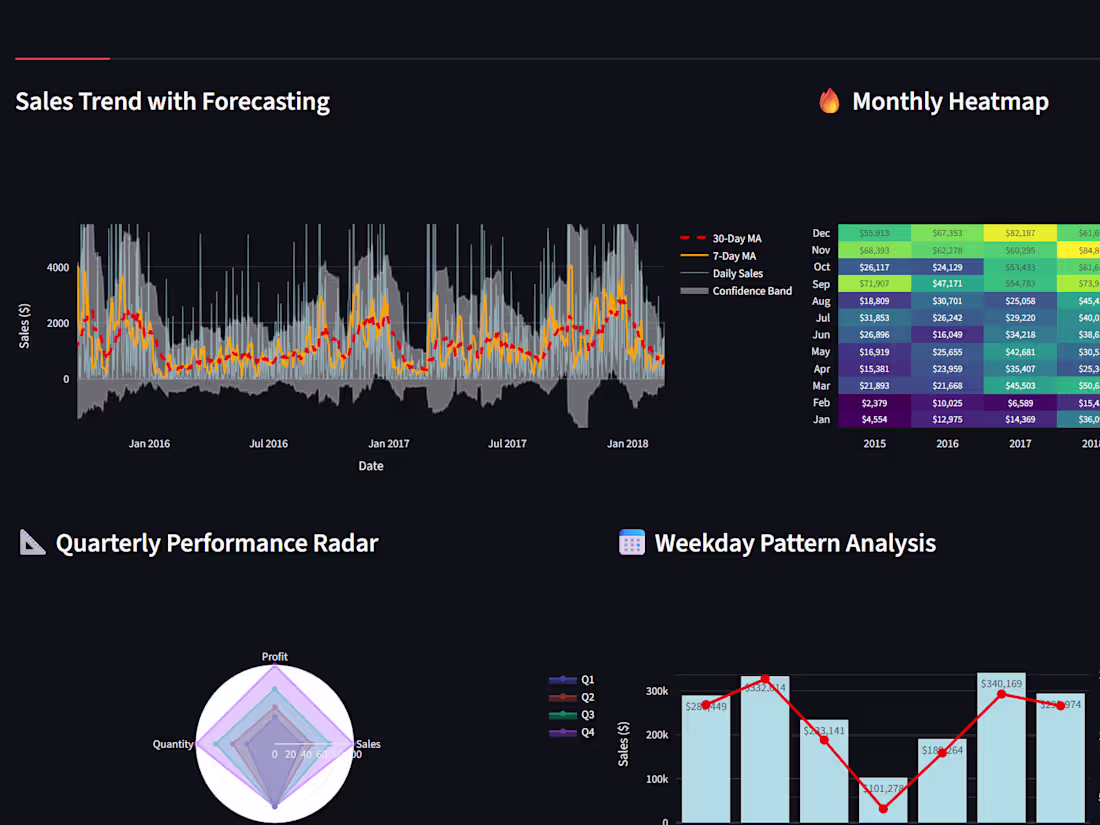
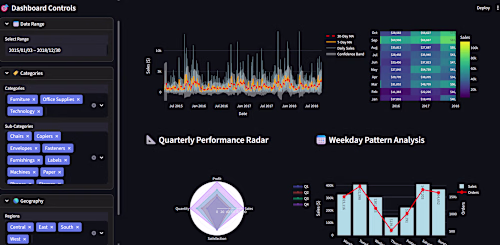
Interactive Data Dashboard
A fully functional, interactive dashboard that visualizes key metrics, trends, and KPIs. Users can filter, drill down, and explore data dynamically.
Custom Data Integration
Integration of multiple data sources, including Excel, CSV, SQL databases, or APIs, to ensure all relevant information is captured accurately.
Automated Data Updates
Automation setup to refresh dashboard data regularly, providing real-time or scheduled insights without manual intervention
Visualizations & Reports
Clean, interactive charts, graphs, and tables for actionable insights, accompanied by downloadable or shareable reports for stakeholders.
Source Code & Documentation
Complete, well-documented code with setup instructions, user guide, and maintenance notes for easy future updates.
User-Friendly Interface
Intuitive, easy-to-navigate dashboard layout with responsive design optimized for desktop, tablet, and mobile devices.
KPI & Metrics Customization
Ability to customize and highlight key performance indicators, allowing clients to track metrics most relevant to their business goals.
Gaurav's other services

Starting at$22
Duration2 weeks
Tags
Dash Plotly
Microsoft Power BI
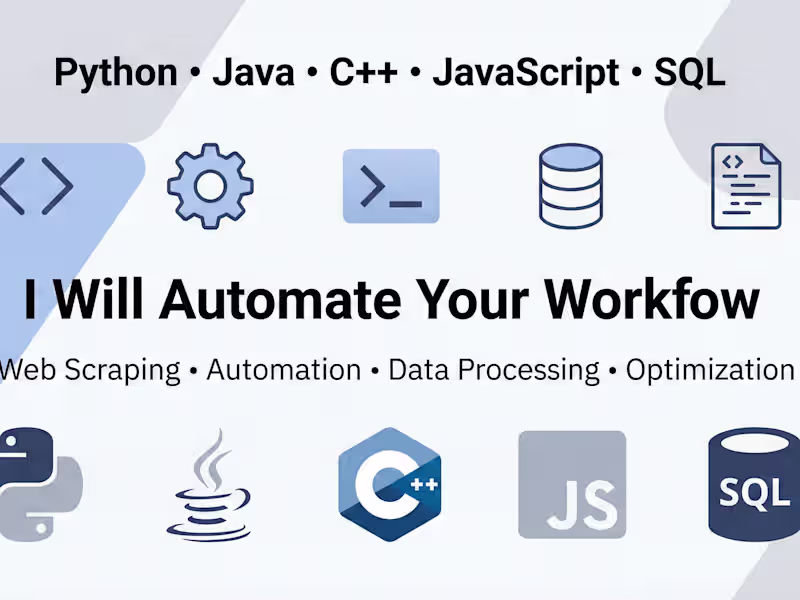
Python
React
Tableau
Data Analyst
Data Modelling Analyst
Data Scientist
Service provided by
Gaurav Acharya Lalitpur, Nepal
Data Analytics & DashboardsGaurav Acharya
Starting at$22
Duration2 weeks
Tags
Dash Plotly
Microsoft Power BI
Python
React
Tableau
Data Analyst
Data Modelling Analyst
Data Scientist
What I Offer
I specialize in custom data analytics and interactive dashboard solutions, transforming raw data into actionable insights that help businesses track performance, monitor KPIs, and make informed decisions.
My Focus
Designing clean, user-friendly, and responsive dashboards
Automated data updates and real-time analytics
Interactive charts, graphs, filters, and reporting
What Makes Me Unique
I combine advanced analytics techniques with intuitive design and software engineering best practices, delivering dashboards that are not only visually appealing but also reliable, scalable, and optimized for decision-making.
What's included
Interactive Data Dashboard
A fully functional, interactive dashboard that visualizes key metrics, trends, and KPIs. Users can filter, drill down, and explore data dynamically.
Custom Data Integration
Integration of multiple data sources, including Excel, CSV, SQL databases, or APIs, to ensure all relevant information is captured accurately.
Automated Data Updates
Automation setup to refresh dashboard data regularly, providing real-time or scheduled insights without manual intervention
Visualizations & Reports
Clean, interactive charts, graphs, and tables for actionable insights, accompanied by downloadable or shareable reports for stakeholders.
Source Code & Documentation
Complete, well-documented code with setup instructions, user guide, and maintenance notes for easy future updates.
User-Friendly Interface
Intuitive, easy-to-navigate dashboard layout with responsive design optimized for desktop, tablet, and mobile devices.
KPI & Metrics Customization
Ability to customize and highlight key performance indicators, allowing clients to track metrics most relevant to their business goals.
Gaurav's other services
$22