
I will make you an interactive DashboardRishi Chakraborty
Offering expertly crafted interactive data visualization dashboards that turn complex data into clear, actionable insights. Using tools like PowerBI, I create engaging, user-friendly visuals that help you make data-driven decisions with ease.
I also provide complex and user oriented designs for the dashboards.
What's included
Interactive Data Visualization Dashboard
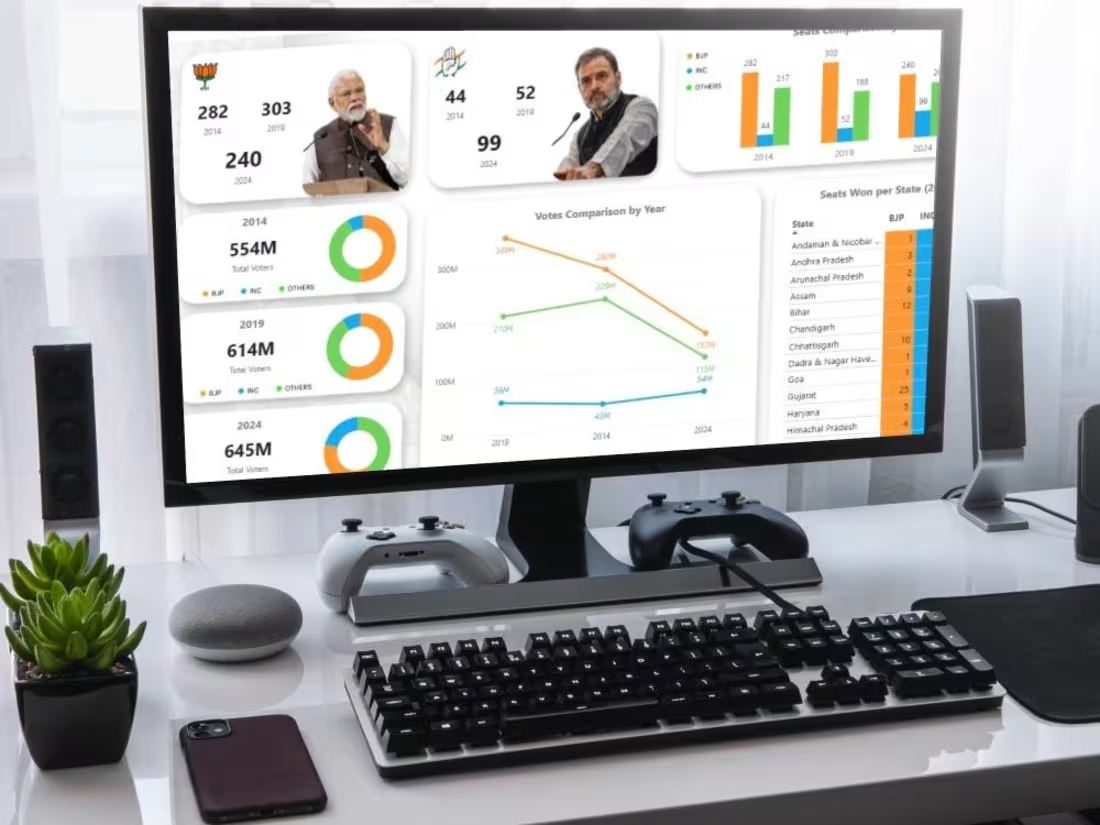
This deliverable includes a custom-built interactive dashboard designed to visualize your data in an engaging and insightful manner. The dashboard will feature:
Dynamic Charts and Graphs: Visualize key metrics and trends with interactive, real-time updates.
Custom Filters and Drill-Downs: Explore data at different levels of granularity with easy-to-use filters and drill-down capabilities.
Clear, Actionable Insights: Present data in a way that highlights important patterns and supports data-driven decision-making.
User-Friendly Design: Intuitive layout and navigation for a seamless user experience.
Delivered as a fully interactive dashboard ready to enhance your data analysis and reporting.
Starting at$100
Duration3 days
Tags
Microsoft Excel
Microsoft Power BI
MySQL
Data Analyst
Database Administrator
Data Visualizer
Service provided by
Rishi Chakraborty India
I will make you an interactive DashboardRishi Chakraborty
Starting at$100
Duration3 days
Tags
Microsoft Excel
Microsoft Power BI
MySQL
Data Analyst
Database Administrator
Data Visualizer
Offering expertly crafted interactive data visualization dashboards that turn complex data into clear, actionable insights. Using tools like PowerBI, I create engaging, user-friendly visuals that help you make data-driven decisions with ease.
I also provide complex and user oriented designs for the dashboards.
What's included
Interactive Data Visualization Dashboard
This deliverable includes a custom-built interactive dashboard designed to visualize your data in an engaging and insightful manner. The dashboard will feature:
Dynamic Charts and Graphs: Visualize key metrics and trends with interactive, real-time updates.
Custom Filters and Drill-Downs: Explore data at different levels of granularity with easy-to-use filters and drill-down capabilities.
Clear, Actionable Insights: Present data in a way that highlights important patterns and supports data-driven decision-making.
User-Friendly Design: Intuitive layout and navigation for a seamless user experience.
Delivered as a fully interactive dashboard ready to enhance your data analysis and reporting.
$100