
Power BI Business KPI DashboardJeet Tiwari
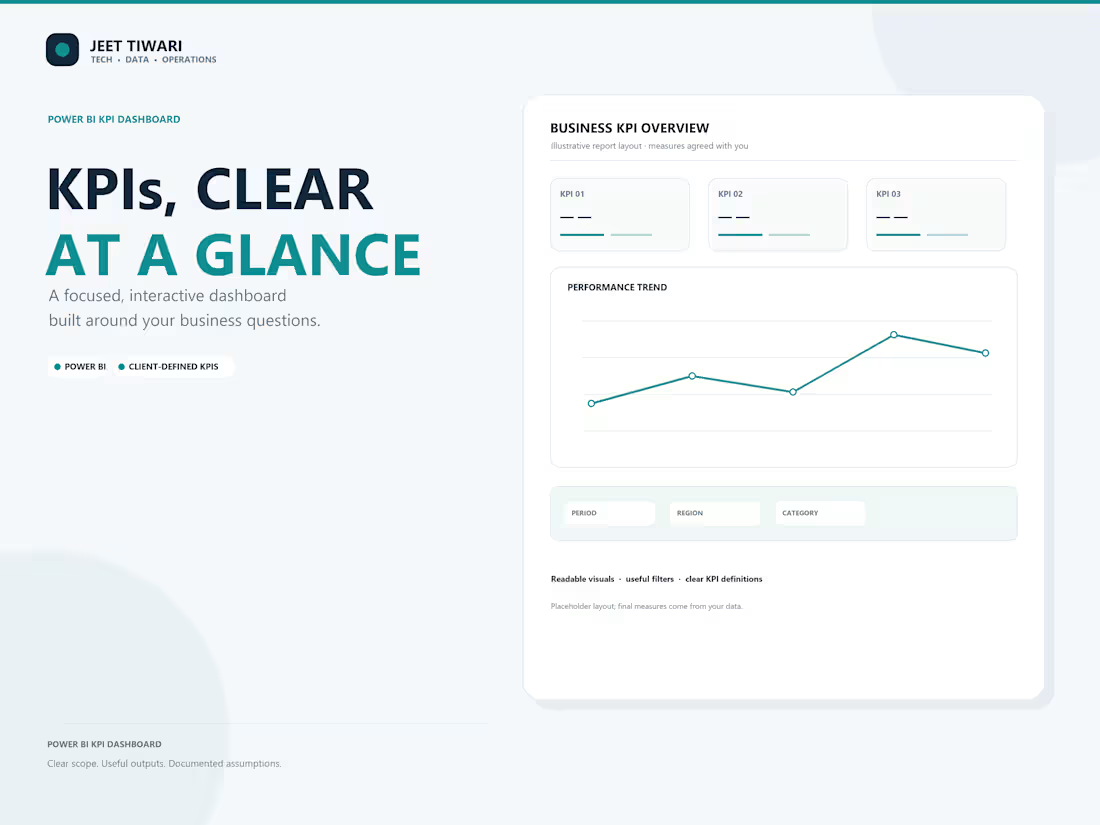
See the KPIs that matter, in one clear Power BI view
If your team has reports scattered across spreadsheets or struggles to review performance quickly, I will organize one agreed dataset into a focused Power BI dashboard built around the questions you need to answer.
What you will receive
One prepared source dataset for the agreed report
A concise KPI list with definitions confirmed before the build
One interactive dashboard with up to two pages and six agreed KPIs
Readable visuals, filters, clear titles, units, and labels
A short guide for using and refreshing the report
One review round for layout and clarity
How we will work
Confirm your audience, decision questions, data source, and KPI definitions.
Check the data and share a proposed dashboard outline.
Build the dashboard and review it with you.
Deliver the Power BI file and handoff guide.
Starter scope
One client-provided data source, up to two dashboard pages, six KPIs, and one revision round. The delivery timeline is confirmed after reviewing the data and approving the KPI list.
What I need from you
Please provide an Excel or CSV export, definitions for key metrics, and any brand colors or logo files you want included.
Tools and boundaries
Microsoft Power BI and Microsoft Excel. Data gateways, scheduled refresh, live connections, and third-party integrations are outside this starter scope and can be discussed separately.
Contact for pricing
Duration1 week
Tags
Microsoft Excel

Business Intelligence
Data Visualizer
Power BI
KPI Dashboard
Service provided by
Jeet Tiwari Ahmedabad, India
- 3
- Followers
Power BI Business KPI DashboardJeet Tiwari
Contact for pricing
Duration1 week
Tags
Microsoft Excel
Business Intelligence
Data Visualizer
Power BI
KPI Dashboard
See the KPIs that matter, in one clear Power BI view
If your team has reports scattered across spreadsheets or struggles to review performance quickly, I will organize one agreed dataset into a focused Power BI dashboard built around the questions you need to answer.
What you will receive
One prepared source dataset for the agreed report
A concise KPI list with definitions confirmed before the build
One interactive dashboard with up to two pages and six agreed KPIs
Readable visuals, filters, clear titles, units, and labels
A short guide for using and refreshing the report
One review round for layout and clarity
How we will work
Confirm your audience, decision questions, data source, and KPI definitions.
Check the data and share a proposed dashboard outline.
Build the dashboard and review it with you.
Deliver the Power BI file and handoff guide.
Starter scope
One client-provided data source, up to two dashboard pages, six KPIs, and one revision round. The delivery timeline is confirmed after reviewing the data and approving the KPI list.
What I need from you
Please provide an Excel or CSV export, definitions for key metrics, and any brand colors or logo files you want included.
Tools and boundaries
Microsoft Power BI and Microsoft Excel. Data gateways, scheduled refresh, live connections, and third-party integrations are outside this starter scope and can be discussed separately.
Contact for pricing