
Communicate Insights Clearly with Compelling Data VisualsLuis Miguel Pabon
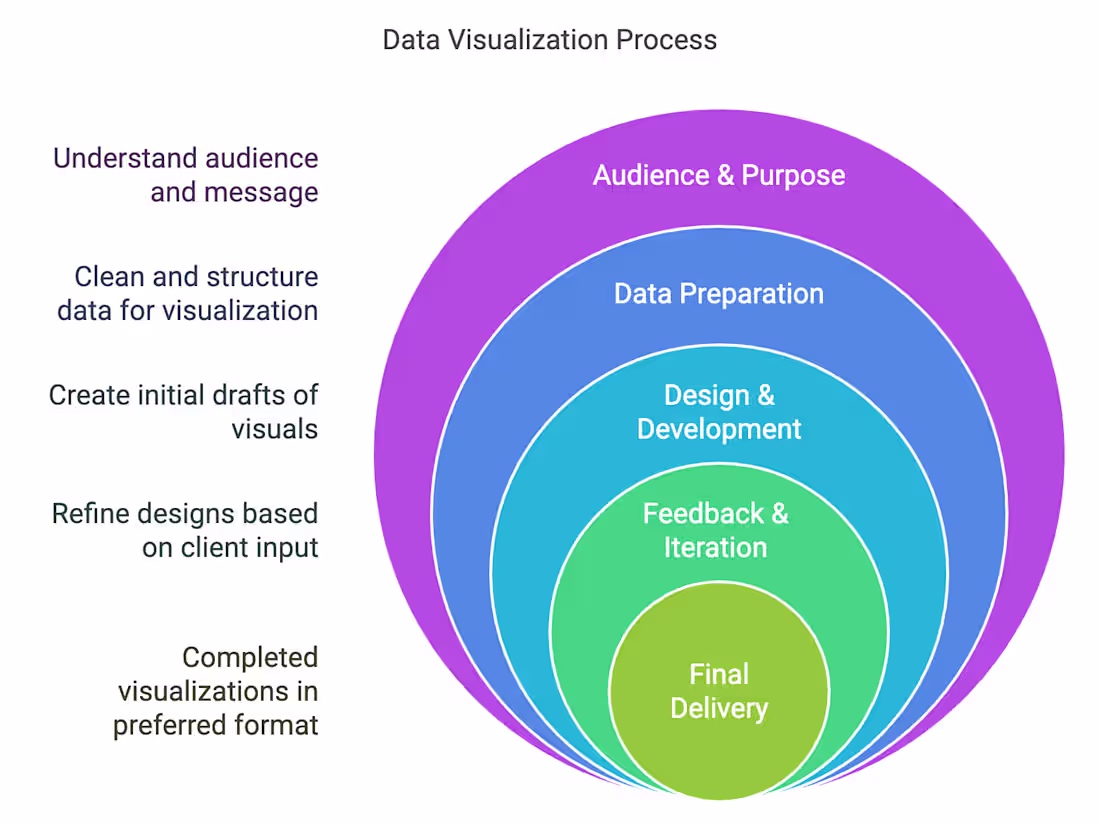
I transform complex data into clear and compelling visuals, enabling effective communication of findings to key stakeholders. My expertise ensures your data tells a powerful story, facilitating easier comprehension and driving informed decisions.
What's included
Interactive Dashboards
Dynamic and user-friendly visualizations designed for exploration and insight.
Custom Charts & Graphs
Static or interactive visual representations of key data points.
Presentation-Ready Visuals
High-quality graphics optimized for reports and presentations.
FAQs
Contact for pricing
Tags
Canva
Microsoft Power BI
Python
R
Tableau
Business Analyst
Data Analyst
Data Visualizer
Service provided by
Luis Miguel Pabon Abbotsford, Canada
Communicate Insights Clearly with Compelling Data VisualsLuis Miguel Pabon
Contact for pricing
Tags
Canva
Microsoft Power BI
Python
R
Tableau
Business Analyst
Data Analyst
Data Visualizer
I transform complex data into clear and compelling visuals, enabling effective communication of findings to key stakeholders. My expertise ensures your data tells a powerful story, facilitating easier comprehension and driving informed decisions.
What's included
Interactive Dashboards
Dynamic and user-friendly visualizations designed for exploration and insight.
Custom Charts & Graphs
Static or interactive visual representations of key data points.
Presentation-Ready Visuals
High-quality graphics optimized for reports and presentations.
FAQs
Contact for pricing