
Power BI Dashboard Development and Data VisualizationIan Mahubi
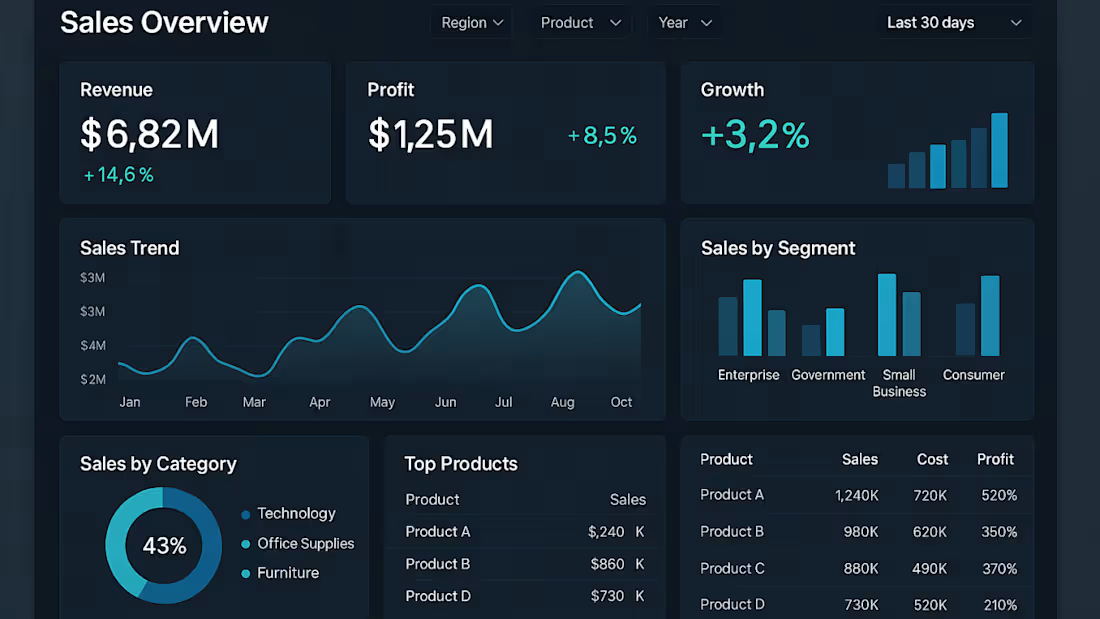
I will transform your data into interactive Power BI dashboards that help you monitor performance and understand business trends.
Services include:
Interactive dashboard development.
KPI creation and performance tracking.
DAX measures and calculated columns.
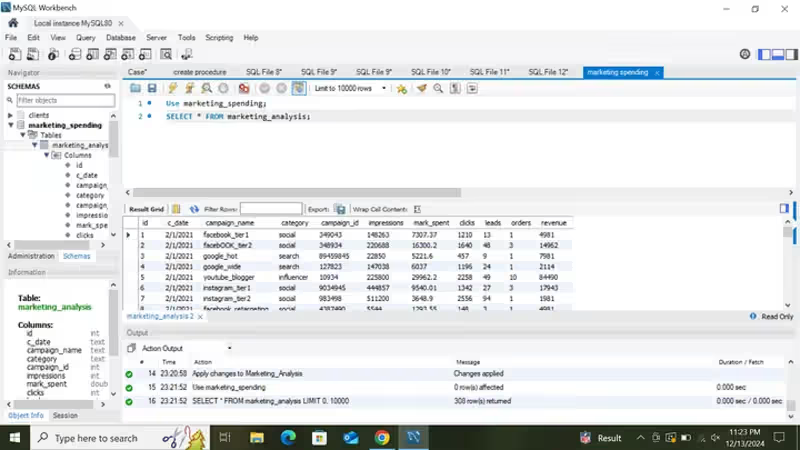
Data modeling and relationships.
Charts, tables and visual reports.
Business performance analysis.
I work with Power BI, Power Query and DAX.
You will receive a Power BI report file and a summary of key findings.
Please share your dataset and reporting objectives before placing an order.
FAQs
Starting at$50
Duration4 days
Tags
Dashboard Design
DAX
Microsoft Power BI

Business Intelligence
Data Analyst
Data Visualizer
KPI Reporting
Service provided by
Ian Mahubi Nairobi, Kenya
Power BI Dashboard Development and Data VisualizationIan Mahubi
Starting at$50
Duration4 days
Tags
Dashboard Design
DAX
Microsoft Power BI
Business Intelligence
Data Analyst
Data Visualizer
KPI Reporting
I will transform your data into interactive Power BI dashboards that help you monitor performance and understand business trends.
Services include:
Interactive dashboard development.
KPI creation and performance tracking.
DAX measures and calculated columns.
Data modeling and relationships.
Charts, tables and visual reports.
Business performance analysis.
I work with Power BI, Power Query and DAX.
You will receive a Power BI report file and a summary of key findings.
Please share your dataset and reporting objectives before placing an order.
FAQs
$50