
Data Visualization and data storytelling ServicesYusuf D
Most teams have data.
Fewer teams trust it enough to make decisions with it.
I help businesses turn raw data into clear, reliable insights they can confidently act on. My focus is not just building dashboards, but fixing the data and definitions underneath so reporting stays accurate as the business grows.
My work typically includes:
YoY and MoM performance analysis
KPI dashboards built for clarity, not decoration
Clean, scalable data models
Automated data refresh and scheduled reporting
Sensible access control and reporting reliability
I work primarily with Power BI, SQL, and Excel, with a strong emphasis on data correctness, metric alignment, and maintainable models.
Clients usually reach out when:
Dashboards look good but create more questions than answers
Numbers don’t match across reports
Reporting is manual, fragile, or slow
Stakeholders don’t fully trust the data
My approach is straightforward: understand the business question first, fix the data underneath it, then design reporting that supports real decisions. I communicate clearly, validate assumptions early, and avoid unnecessary complexity.
What I Can Help You With
End-to-end Power BI dashboards
YoY / MoM analysis and performance tracking
KPI definition and reporting
Data modeling and optimization
Automated refresh pipelines
Excel analysis (structured models, pivots, charts)
SQL querying for analytics and reporting
Remote-friendly. Contract or short-term projects welcome.
If you’re unsure exactly what you need yet, that’s fine. We can start with a short call to clarify the problem before committing to a build.
What's included
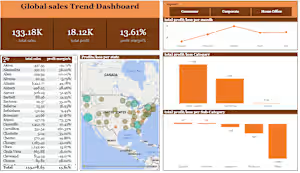
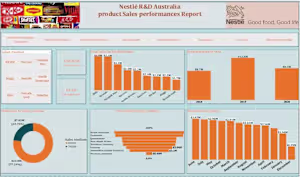
Data visualization
Data visualization on Power BI and Microsoft Excel, including charts, pivot tables, graphs, maps, reports and dashboards
Data wrangleing
Data cleaning, analysis, modelling, and reporting,
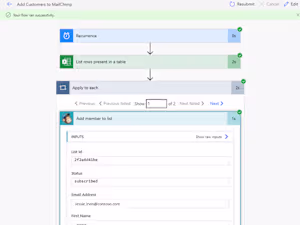
Automation
Automated Excel and Zapier workflows that eliminate repetitive tasks and support accurate, scalable data analysis.
Data manipulation and database management and optimization
Data manipulation on Power Query
• Database management with SQL
FAQs
Yes, I am proficient in DAX, pivot table and power pivot. I have been using it for over three years to create complex calculations and measures for various data models.
I'm very responsive so u can reach out to me anytime and be rest assured that I respond swiftly.
Yes I can. recently completed a similar project, combining different file in excel and power query into a single file and more
Proficiency with SQL
• Expert (7 + years) designing and optimizing complex queries (CTEs, window functions, sub-queries)
• Performance tuning (indexing, execution plans) for high-volume e-commerce datasets
• ETL development and schema design in PostgreSQL, MySQL, Snowflake and SQL Server environments

Contact for pricing
Tags
Microsoft Excel


Microsoft Power BI

PostgreSQL

Data Analyst
Data Modelling Analyst
Data Scientist
Service provided by
Yusuf D Lagos, Nigeria
Data Visualization and data storytelling ServicesYusuf D
Contact for pricing
Tags
Microsoft Excel
Microsoft Power BI
PostgreSQL
Data Analyst
Data Modelling Analyst
Data Scientist
Most teams have data.
Fewer teams trust it enough to make decisions with it.
I help businesses turn raw data into clear, reliable insights they can confidently act on. My focus is not just building dashboards, but fixing the data and definitions underneath so reporting stays accurate as the business grows.
My work typically includes:
YoY and MoM performance analysis
KPI dashboards built for clarity, not decoration
Clean, scalable data models
Automated data refresh and scheduled reporting
Sensible access control and reporting reliability
I work primarily with Power BI, SQL, and Excel, with a strong emphasis on data correctness, metric alignment, and maintainable models.
Clients usually reach out when:
Dashboards look good but create more questions than answers
Numbers don’t match across reports
Reporting is manual, fragile, or slow
Stakeholders don’t fully trust the data
My approach is straightforward: understand the business question first, fix the data underneath it, then design reporting that supports real decisions. I communicate clearly, validate assumptions early, and avoid unnecessary complexity.
What I Can Help You With
End-to-end Power BI dashboards
YoY / MoM analysis and performance tracking
KPI definition and reporting
Data modeling and optimization
Automated refresh pipelines
Excel analysis (structured models, pivots, charts)
SQL querying for analytics and reporting
Remote-friendly. Contract or short-term projects welcome.
If you’re unsure exactly what you need yet, that’s fine. We can start with a short call to clarify the problem before committing to a build.
What's included
Data visualization
Data visualization on Power BI and Microsoft Excel, including charts, pivot tables, graphs, maps, reports and dashboards
Data wrangleing
Data cleaning, analysis, modelling, and reporting,
Automation
Automated Excel and Zapier workflows that eliminate repetitive tasks and support accurate, scalable data analysis.
Data manipulation and database management and optimization
Data manipulation on Power Query
• Database management with SQL
FAQs
Yes, I am proficient in DAX, pivot table and power pivot. I have been using it for over three years to create complex calculations and measures for various data models.
I'm very responsive so u can reach out to me anytime and be rest assured that I respond swiftly.
Yes I can. recently completed a similar project, combining different file in excel and power query into a single file and more
Proficiency with SQL
• Expert (7 + years) designing and optimizing complex queries (CTEs, window functions, sub-queries)
• Performance tuning (indexing, execution plans) for high-volume e-commerce datasets
• ETL development and schema design in PostgreSQL, MySQL, Snowflake and SQL Server environments
Contact for pricing