
Graphs that Speak!!!Muhammad Rafay Khan
📊 Project Scope & Guidelines: Data Visualization & Analysis
1. Initial Consultation:
Objective: Understand the client's goals, objectives, and data requirements.
Client Input: Provide detailed information about the data sources, desired outcomes, and any specific preferences.
2. Proposal & Agreement:
Scope Definition: Clearly outline the scope, including the number of visualizations, data sources, and desired outcomes.
Agreement: Sign a formal agreement detailing project terms, timelines, and deliverables.
3. Data Collection & Preparation:
Data Sharing: Clients should provide access to relevant and accurate data sources.
Data Cleaning: Address any data quality issues and prepare the data for analysis.
4. Analysis & Visualization Design:
Iterative Process: Regular updates on analysis progress and visualization design.
Client Feedback: Encourage feedback on analysis approaches and visualization prototypes.
5. Dashboard Development:
Customization: Develop customized dashboards based on client needs.
User Interactivity: Include interactive features for a dynamic user experience.
6. Review & Revisions:
Client Input: Actively involve clients in reviewing visualizations and provide a specified number of revisions.
Alignment: Ensure visualizations align with client expectations and goals.
7. Data Storytelling:
Narrative Development: Craft a data-driven narrative to accompany visualizations.
Contextualization: Provide context for the data story to enhance understanding.
8. Finalization & Delivery:
Approval Process: Seek client approval for the final set of visualizations and analysis.
Delivery: Provide the final visualizations in the agreed-upon format.
9. Training and Documentation (Optional):
User Training: Optionally, provide training materials or sessions for effective use of visualizations.
Documentation: Include documentation for interpreting visualizations.
10. Communication:
- Timely Updates: Regularly update clients on project progress.
- Feedback Channels: Establish clear channels for feedback and communication.
11. Post-Implementation Support:
- Follow-Up: Offer post-implementation support for questions or adjustments.
- Collaboration: Encourage ongoing collaboration for future data analysis needs.
By following these phases and guidelines, we aim to create a collaborative and transparent process, resulting in effective Data Visualization & Analysis outcomes that align with the client's goals.
What's included
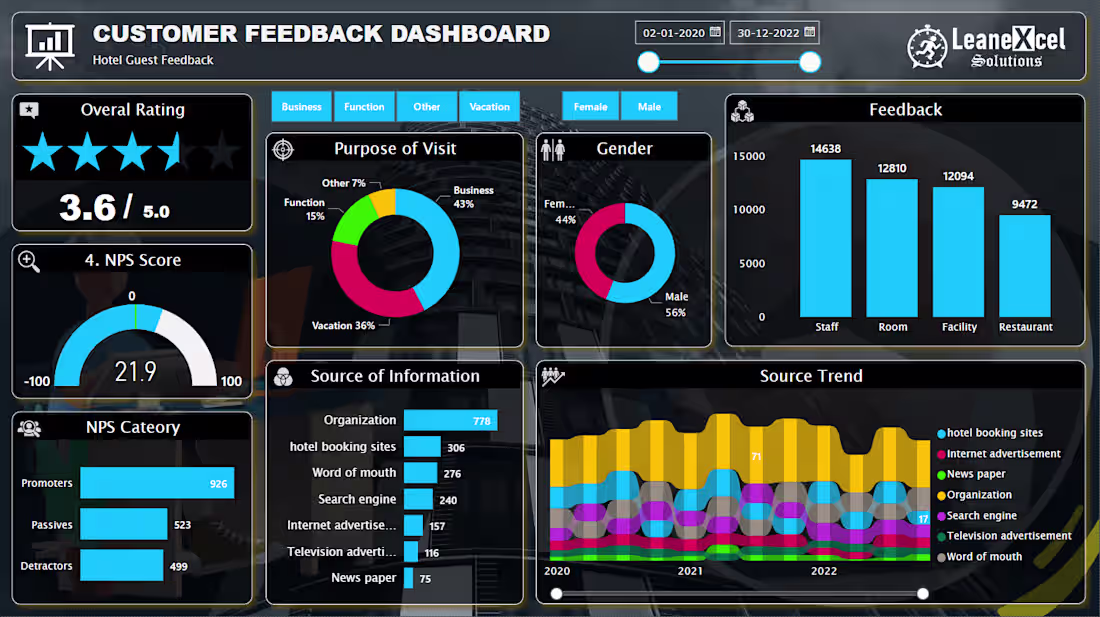
Customized Dashboards
Creation of interactive and visually appealing dashboards tailored to the client's data needs.
Integration of key performance indicators (KPIs) for quick insights.
Visual Reports
Comprehensive visual reports summarizing data trends, patterns, and outliers.
Graphical representations of key metrics to facilitate quick understanding.
Infographics
Design and development of infographics presenting complex data in a clear and engaging manner.
Infographics that highlight key findings and statistical summaries.
Data Exploration Tools
Development of tools or interfaces for clients to explore their data interactively.
Implementation of user-friendly features for filtering, sorting, and drilling down into details.
Interactive Charts and Graphs
Creation of dynamic and interactive charts and graphs to represent data relationships.
Integration of tooltips and interactive elements for a richer user experience.
Data Storytelling Documents
Compelling narratives that accompany visualizations, providing context and actionable insights.
Story-driven documents that guide the client through the data story.
Heatmaps and Geographic Visualizations
Utilization of heatmaps and geographic visualizations for spatial analysis.
Identification of geographical trends and patterns.
Raw Data Files
Provision of raw data files used for analysis and visualization.
Compatibility with common data formats (e.g., CSV, Excel) for easy access.
Analysis Code and Algorithms (Optional)
If applicable, sharing of analysis code and algorithms used in the data analysis process.
Encouragement of transparency and collaboration for more technical clients.
Training Materials (Optional)
Development of training materials to help clients understand and utilize the visualizations.
User guides or tutorial videos for effective usage.
Revisions and Edits
Inclusion of a specified number of revisions to accommodate client feedback.
Collaboration for refining visualizations based on client preferences.
Muhammad Rafay's other services

Contact for pricing
Tags
IBM Watson
Microsoft Excel
Microsoft Power BI
Microsoft SQL Server
Tableau
Business Analyst
Data Analyst
Data Scientist
Service provided by
Muhammad Rafay Khan Karachi, Pakistan
- 2
- Followers
Graphs that Speak!!!Muhammad Rafay Khan
Contact for pricing
Tags
IBM Watson
Microsoft Excel
Microsoft Power BI
Microsoft SQL Server
Tableau
Business Analyst
Data Analyst
Data Scientist
📊 Project Scope & Guidelines: Data Visualization & Analysis
1. Initial Consultation:
Objective: Understand the client's goals, objectives, and data requirements.
Client Input: Provide detailed information about the data sources, desired outcomes, and any specific preferences.
2. Proposal & Agreement:
Scope Definition: Clearly outline the scope, including the number of visualizations, data sources, and desired outcomes.
Agreement: Sign a formal agreement detailing project terms, timelines, and deliverables.
3. Data Collection & Preparation:
Data Sharing: Clients should provide access to relevant and accurate data sources.
Data Cleaning: Address any data quality issues and prepare the data for analysis.
4. Analysis & Visualization Design:
Iterative Process: Regular updates on analysis progress and visualization design.
Client Feedback: Encourage feedback on analysis approaches and visualization prototypes.
5. Dashboard Development:
Customization: Develop customized dashboards based on client needs.
User Interactivity: Include interactive features for a dynamic user experience.
6. Review & Revisions:
Client Input: Actively involve clients in reviewing visualizations and provide a specified number of revisions.
Alignment: Ensure visualizations align with client expectations and goals.
7. Data Storytelling:
Narrative Development: Craft a data-driven narrative to accompany visualizations.
Contextualization: Provide context for the data story to enhance understanding.
8. Finalization & Delivery:
Approval Process: Seek client approval for the final set of visualizations and analysis.
Delivery: Provide the final visualizations in the agreed-upon format.
9. Training and Documentation (Optional):
User Training: Optionally, provide training materials or sessions for effective use of visualizations.
Documentation: Include documentation for interpreting visualizations.
10. Communication:
- Timely Updates: Regularly update clients on project progress.
- Feedback Channels: Establish clear channels for feedback and communication.
11. Post-Implementation Support:
- Follow-Up: Offer post-implementation support for questions or adjustments.
- Collaboration: Encourage ongoing collaboration for future data analysis needs.
By following these phases and guidelines, we aim to create a collaborative and transparent process, resulting in effective Data Visualization & Analysis outcomes that align with the client's goals.
What's included
Customized Dashboards
Creation of interactive and visually appealing dashboards tailored to the client's data needs.
Integration of key performance indicators (KPIs) for quick insights.
Visual Reports
Comprehensive visual reports summarizing data trends, patterns, and outliers.
Graphical representations of key metrics to facilitate quick understanding.
Infographics
Design and development of infographics presenting complex data in a clear and engaging manner.
Infographics that highlight key findings and statistical summaries.
Data Exploration Tools
Development of tools or interfaces for clients to explore their data interactively.
Implementation of user-friendly features for filtering, sorting, and drilling down into details.
Interactive Charts and Graphs
Creation of dynamic and interactive charts and graphs to represent data relationships.
Integration of tooltips and interactive elements for a richer user experience.
Data Storytelling Documents
Compelling narratives that accompany visualizations, providing context and actionable insights.
Story-driven documents that guide the client through the data story.
Heatmaps and Geographic Visualizations
Utilization of heatmaps and geographic visualizations for spatial analysis.
Identification of geographical trends and patterns.
Raw Data Files
Provision of raw data files used for analysis and visualization.
Compatibility with common data formats (e.g., CSV, Excel) for easy access.
Analysis Code and Algorithms (Optional)
If applicable, sharing of analysis code and algorithms used in the data analysis process.
Encouragement of transparency and collaboration for more technical clients.
Training Materials (Optional)
Development of training materials to help clients understand and utilize the visualizations.
User guides or tutorial videos for effective usage.
Revisions and Edits
Inclusion of a specified number of revisions to accommodate client feedback.
Collaboration for refining visualizations based on client preferences.
Muhammad Rafay's other services
Contact for pricing