
Dashboards From Your Spreadsheets: Sales, Orders and KPIsEklavya Shetty
Your numbers already sit in a spreadsheet, a survey or a tool. I turn them into a dashboard people actually read, refreshed from your data.
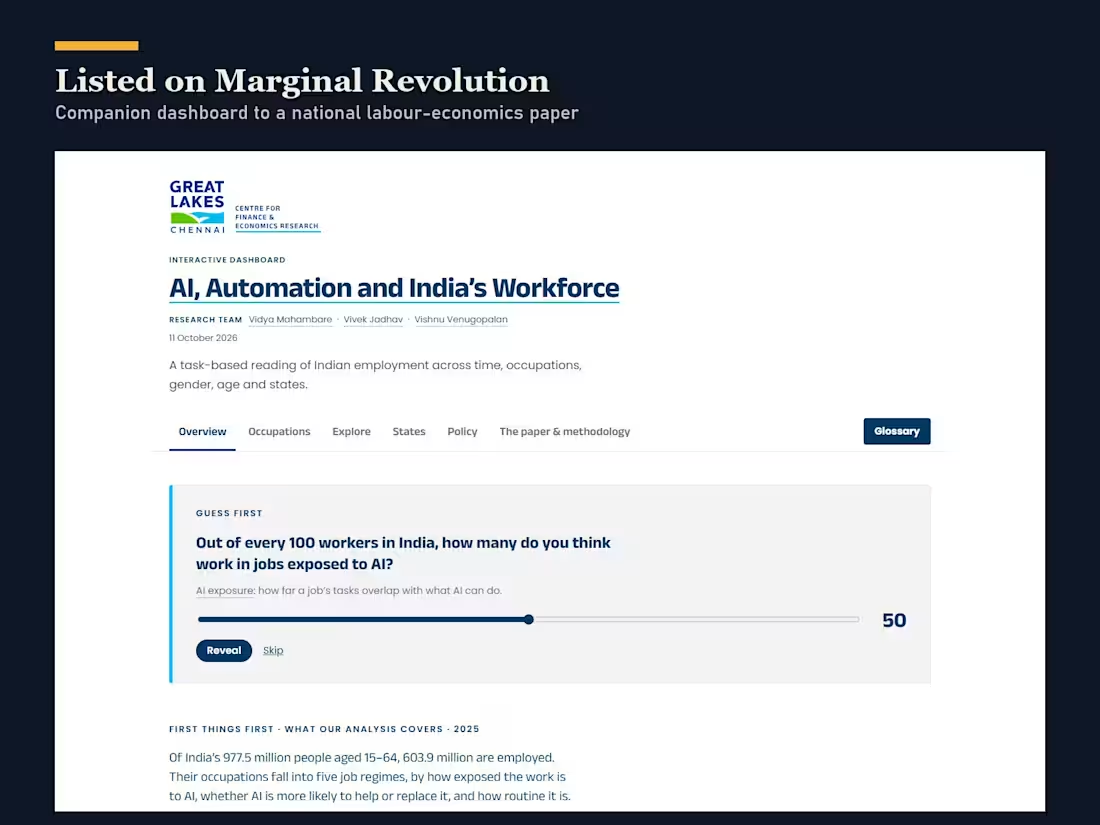
Recent work: the companion dashboard for Great Lakes' GLCFER Working Paper 5, AI, Automation and India's Workforce (glcfer.allforone.co.in). State maps, group comparisons, quizzes and shareable views. It was listed on Marginal Revolution and recommended by India's Chief Economic Adviser at the launch.
What's included:
One dashboard page in Google Sheets, Looker Studio, Excel or a simple web page: up to 8 charts and KPI cards
Connected to your sheet or export so it refreshes by itself
Filters for date range, team, product or region
A 5-minute recorded walkthrough
Also available: a full interactive web dashboard like the GLCFER one, with maps, comparisons and shareable links, $800 ($400 founding), 14 days.
Founding price: $150 for my first 3 clients on this service, in exchange for an honest review. After that it's $300.
Send me a sample of the data with personal details removed and I'll send back a screenshot of the first chart before you pay.

Dashboards From Your Spreadsheets: Sales, Orders and KPIsEklavya Shetty
Starting at$150
Duration5 days
Tags
Dashboard
Your numbers already sit in a spreadsheet, a survey or a tool. I turn them into a dashboard people actually read, refreshed from your data.
Recent work: the companion dashboard for Great Lakes' GLCFER Working Paper 5, AI, Automation and India's Workforce (glcfer.allforone.co.in). State maps, group comparisons, quizzes and shareable views. It was listed on Marginal Revolution and recommended by India's Chief Economic Adviser at the launch.
What's included:
One dashboard page in Google Sheets, Looker Studio, Excel or a simple web page: up to 8 charts and KPI cards
Connected to your sheet or export so it refreshes by itself
Filters for date range, team, product or region
A 5-minute recorded walkthrough
Also available: a full interactive web dashboard like the GLCFER one, with maps, comparisons and shareable links, $800 ($400 founding), 14 days.
Founding price: $150 for my first 3 clients on this service, in exchange for an honest review. After that it's $300.
Send me a sample of the data with personal details removed and I'll send back a screenshot of the first chart before you pay.
$150