
Power BI Sales Dashboard | E-commerce & Financial ReportRashid Mgeni
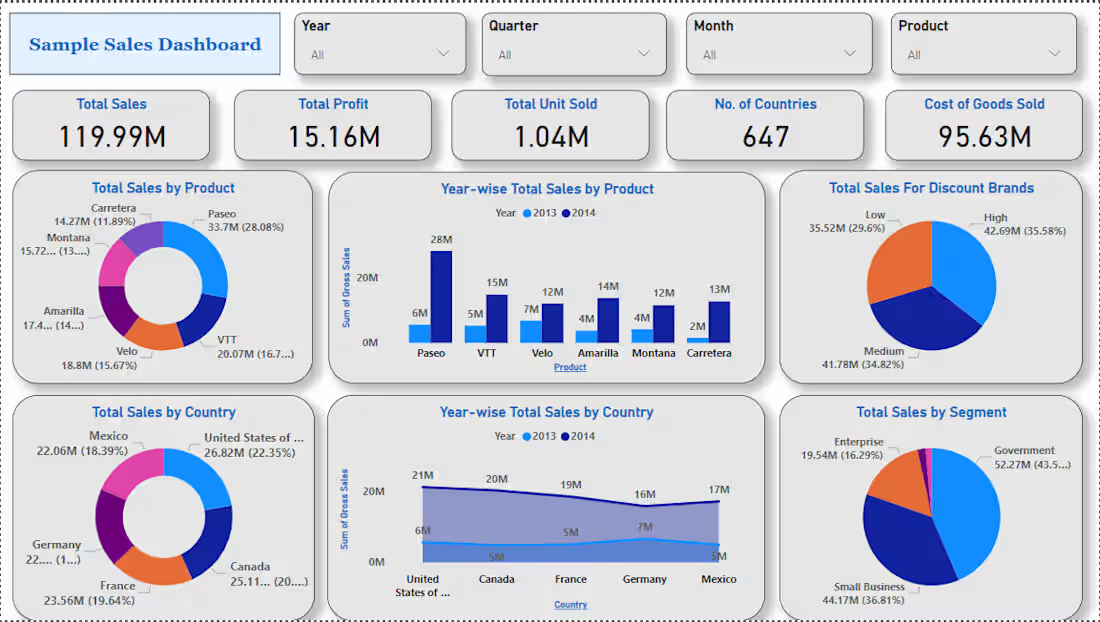
I help e-commerce businesses turn messy sales data into clear, profitable decisions. Example: Tracked $15.16M sales, 1.04M units, 647 countries.
What you get:
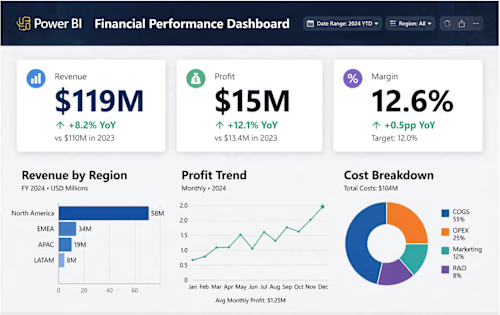
Interactive Power BI dashboard (Revenue, Profit, Margin)
Sales by Region & Profit Trend charts
Automated filters by date and region
Clean Excel file with formulas
Perfect for: Shopify, Amazon sellers, and small business owners who want to know what sells best.
Delivery in 2 days + 1 free revision. Let's turn your data into profit!
Tools: Power BI, Excel, SQL, DAX | From Dar es Salaam, TZ - Worldwide delivery
FAQs
Example work
Starting at$150
Duration2 days
Tags
Microsoft Excel

Microsoft Power BI

SQL

Data Analyst
Data Visualizer
Service provided by
Rashid Mgeni Dar es Salaam, Tanzania
- 2
- Followers
Power BI Sales Dashboard | E-commerce & Financial ReportRashid Mgeni
Starting at$150
Duration2 days
Tags
Microsoft Excel
Microsoft Power BI
SQL
Data Analyst
Data Visualizer
I help e-commerce businesses turn messy sales data into clear, profitable decisions. Example: Tracked $15.16M sales, 1.04M units, 647 countries.
What you get:
Interactive Power BI dashboard (Revenue, Profit, Margin)
Sales by Region & Profit Trend charts
Automated filters by date and region
Clean Excel file with formulas
Perfect for: Shopify, Amazon sellers, and small business owners who want to know what sells best.
Delivery in 2 days + 1 free revision. Let's turn your data into profit!
Tools: Power BI, Excel, SQL, DAX | From Dar es Salaam, TZ - Worldwide delivery
FAQs
Example work
$150