
Market & Analytics Dashboard Design (UI/UX)Girum Tamiru
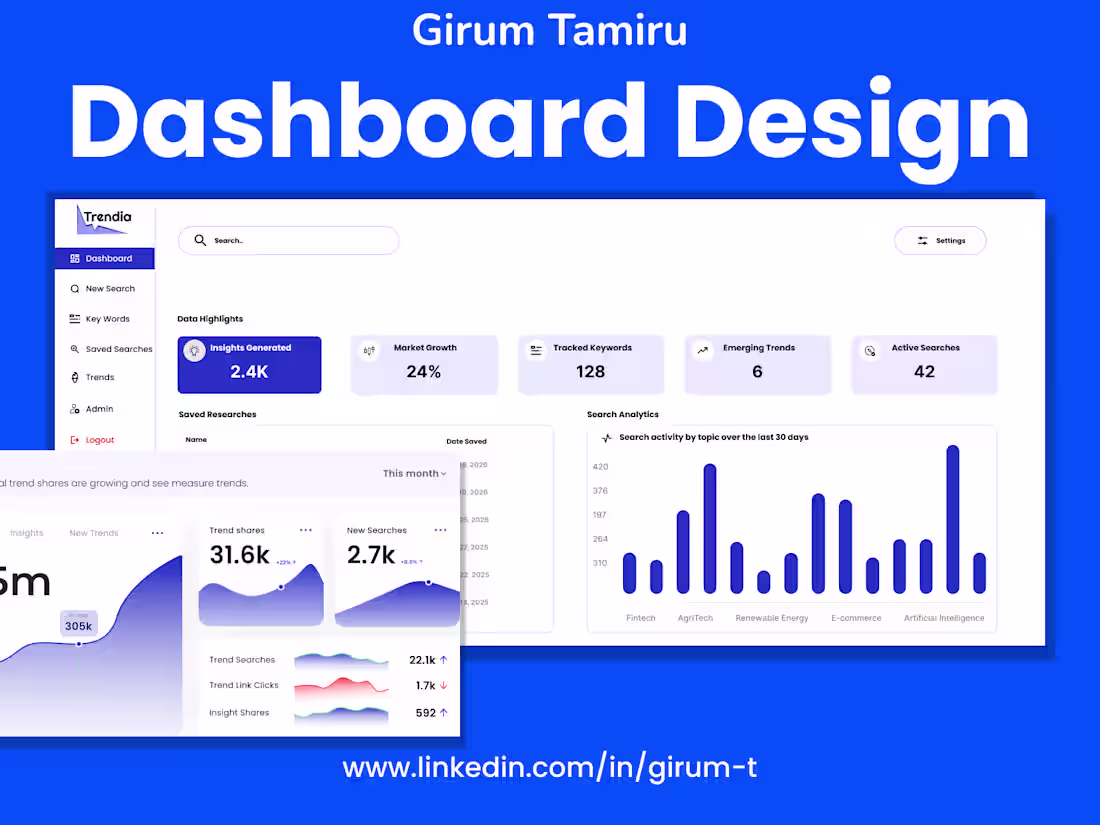
I design analytics dashboards that transform complex data into clear, actionable insights.
My focus is on helping teams quickly understand performance, trends, and opportunities through thoughtful information architecture, data hierarchy, and visual clarity. Each dashboard is designed to support real decision-making—prioritizing what matters most and reducing cognitive overload.
Designs are created in Figma with clean structure, scalable components, and responsive layouts suitable for internal tools, SaaS platforms, and data-driven products.
What you can expect from me
A clear, structured dashboard focused on decision-making
Thoughtful metric prioritization and visual hierarchy
Clean, modern UI that doesn’t overwhelm users
Attention to edge cases (empty data, loading, errors)
Clear communication and organized design files
Dashboard design is not decoration — it’s decision infrastructure.
What's included
Dashboard structure & data hierarchy
Definition of key metrics, layout zones, and information priority to ensure critical insights are immediately visible.
Low-fidelity wireframes
Wireframes outlining dashboard layout, component placement, and user flow before visual styling.
High-fidelity dashboard UI (Figma)
Complete visual dashboard design including charts, tables, filters, typography, spacing, and component states.
Interactive components & states
Design of hover states, empty states, loading states, and interactions to improve usability and clarity.
Responsive dashboard layouts
Optimized layouts for desktop and tablet to maintain readability and usability across screen sizes.
Organized, handoff-ready Figma files
Well-structured Figma files with reusable components and clear naming for smooth development handoff.
FAQs
I design dashboards for analytics, internal tools, SaaS platforms, HR systems, market or performance tracking and so on.
Yes. I help structure and prioritize metrics to ensure dashboards are easy to read and support decision-making.
Most dashboard projects take 1–2 weeks, depending on scope and complexity.
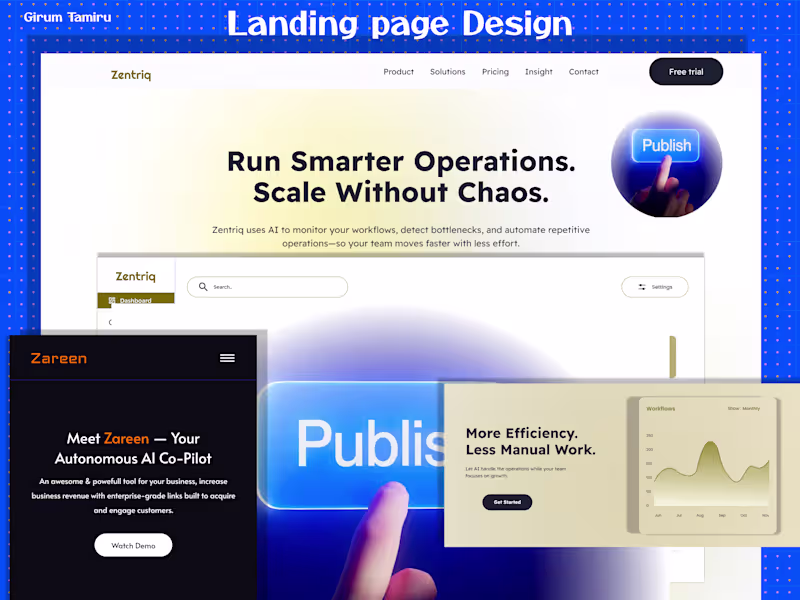
Girum 's other services


Market & Analytics Dashboard Design (UI/UX)Girum Tamiru
Starting at$350
Duration2 weeks
I design analytics dashboards that transform complex data into clear, actionable insights.
My focus is on helping teams quickly understand performance, trends, and opportunities through thoughtful information architecture, data hierarchy, and visual clarity. Each dashboard is designed to support real decision-making—prioritizing what matters most and reducing cognitive overload.
Designs are created in Figma with clean structure, scalable components, and responsive layouts suitable for internal tools, SaaS platforms, and data-driven products.
What you can expect from me
A clear, structured dashboard focused on decision-making
Thoughtful metric prioritization and visual hierarchy
Clean, modern UI that doesn’t overwhelm users
Attention to edge cases (empty data, loading, errors)
Clear communication and organized design files
Dashboard design is not decoration — it’s decision infrastructure.
What's included
Dashboard structure & data hierarchy
Definition of key metrics, layout zones, and information priority to ensure critical insights are immediately visible.
Low-fidelity wireframes
Wireframes outlining dashboard layout, component placement, and user flow before visual styling.
High-fidelity dashboard UI (Figma)
Complete visual dashboard design including charts, tables, filters, typography, spacing, and component states.
Interactive components & states
Design of hover states, empty states, loading states, and interactions to improve usability and clarity.
Responsive dashboard layouts
Optimized layouts for desktop and tablet to maintain readability and usability across screen sizes.
Organized, handoff-ready Figma files
Well-structured Figma files with reusable components and clear naming for smooth development handoff.
FAQs
I design dashboards for analytics, internal tools, SaaS platforms, HR systems, market or performance tracking and so on.
Yes. I help structure and prioritize metrics to ensure dashboards are easy to read and support decision-making.
Most dashboard projects take 1–2 weeks, depending on scope and complexity.
Girum 's other services
$350