
Convert Raw Data to VisualsTyler Tobin
I offer advanced data analysis that is simple to understand, delivering clear insights and actionable results for easy implementation
What's included
Executive Summary
- A concise overview of the key findings, insights, and recommendations derived from the analysis.
Data Cleaning Report
- Documentation of data cleaning steps, including handling missing values, outliers, and data normalization.
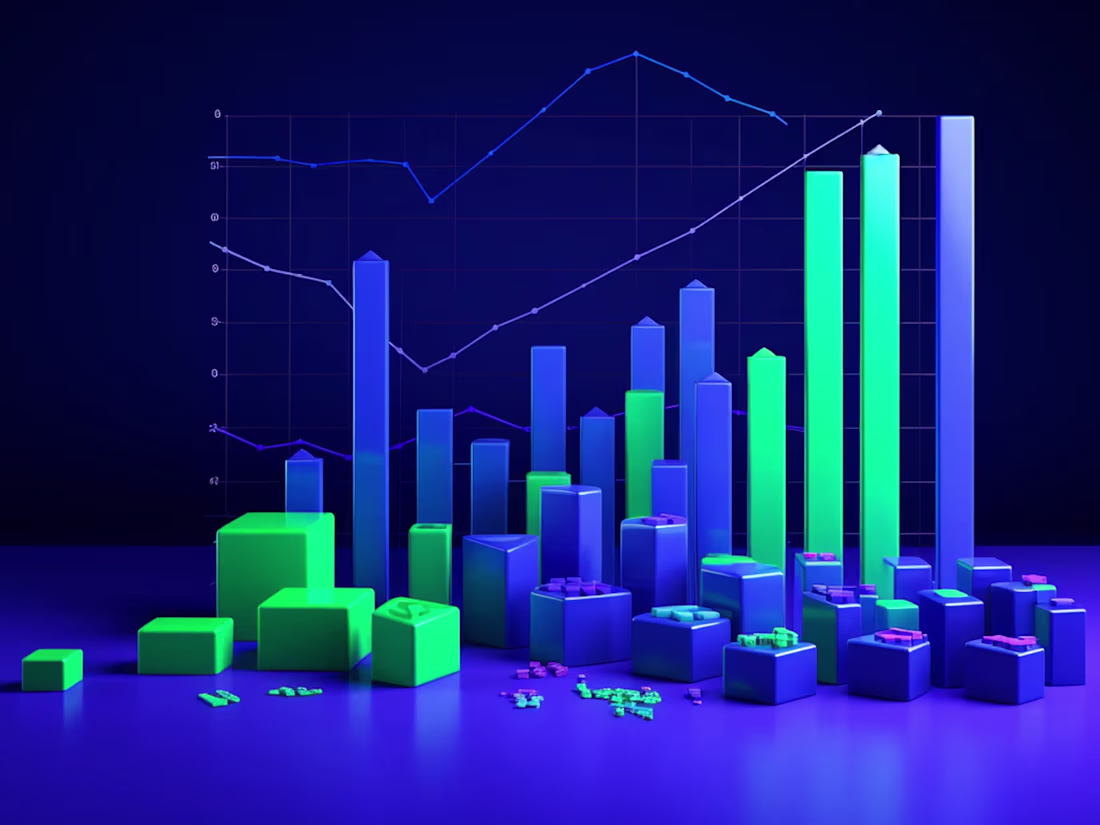
Data Visualization Report
- Visualizations and summary statistics that provide an initial understanding of the data.
- Charts, graphs, and plots that highlight trends, correlations, and patterns in the data.
- A visual report for tracking key performance indicators (KPIs) relevant to the business.
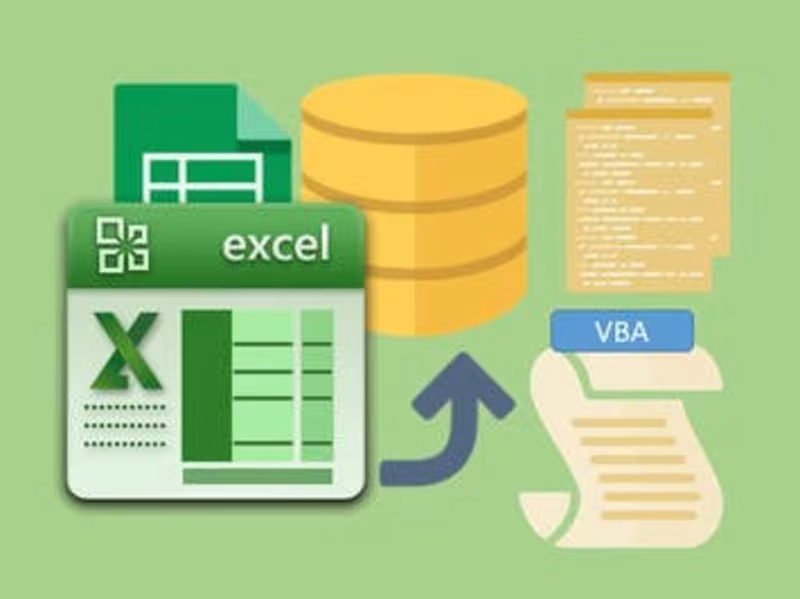
Code or Predictive Models
- The codebase, scripts, or notebooks used for the analysis, are provided for future use or reference.
- Development and deployment of models for forecasting, classification, or regression, along with performance metrics.
Recommendations
- Actionable insights and strategic recommendations based on the data analysis.
- Assessment of the financial or operational impact of implementing the recommended strategies.
- A plan outlining the steps needed to implement the insights and recommendations derived from the analysis.
Tyler's other services
Starting at$35 /hr
Tags
MATLAB
Microsoft Excel
pandas
Tableau
Data Analyst
Statistician
Data Scraper
Service provided by
Tyler Tobin Chicago, USA
Convert Raw Data to VisualsTyler Tobin
Starting at$35 /hr
Tags
MATLAB
Microsoft Excel
pandas
Tableau
Data Analyst
Statistician
Data Scraper
I offer advanced data analysis that is simple to understand, delivering clear insights and actionable results for easy implementation
What's included
Executive Summary
- A concise overview of the key findings, insights, and recommendations derived from the analysis.
Data Cleaning Report
- Documentation of data cleaning steps, including handling missing values, outliers, and data normalization.
Data Visualization Report
- Visualizations and summary statistics that provide an initial understanding of the data.
- Charts, graphs, and plots that highlight trends, correlations, and patterns in the data.
- A visual report for tracking key performance indicators (KPIs) relevant to the business.
Code or Predictive Models
- The codebase, scripts, or notebooks used for the analysis, are provided for future use or reference.
- Development and deployment of models for forecasting, classification, or regression, along with performance metrics.
Recommendations
- Actionable insights and strategic recommendations based on the data analysis.
- Assessment of the financial or operational impact of implementing the recommended strategies.
- A plan outlining the steps needed to implement the insights and recommendations derived from the analysis.
Tyler's other services
$35 /hr