
A Map to show the traffic in USA Muhammad Qadeer
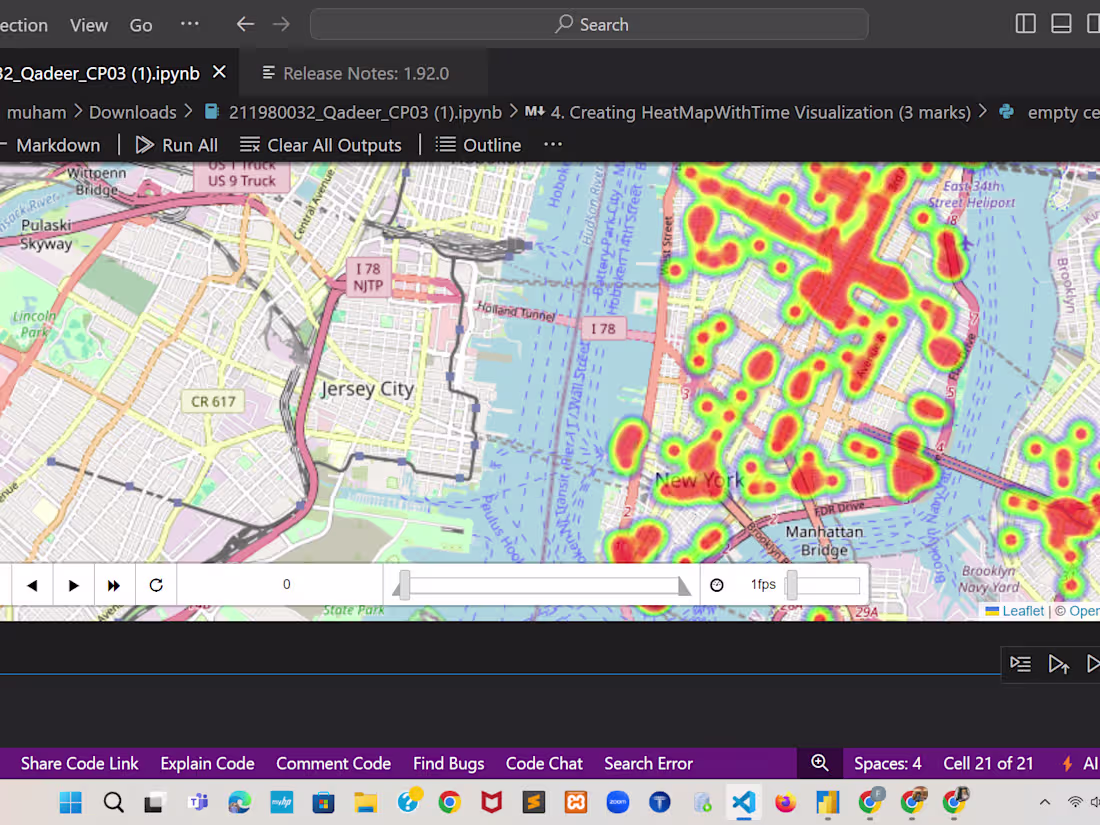
My project aims to provide a comprehensive analysis of traffic patterns in New York City using Python. By leveraging various data visualization libraries and real-time traffic data sources, the project will illustrate traffic density, congestion trends, and peak hours across different boroughs of NYC. Utilizing Python's powerful data processing capabilities, the project will employ tools such as Pandas for data manipulation, Matplotlib and Seaborn for plotting, and Folium for interactive maps. This analysis will not only highlight current traffic conditions but also offer insights into potential improvements and forecasting future traffic scenarios, ultimately contributing to more efficient urban planning and better traffic management strategies.
What's included
A proper report and The code plus the map image
In this project i will give you the source code with a properly documented pdf file and the map image of the USA that will show the traffic
FAQs
Muhammad 's other services
Starting at$20
Duration1 day
Tags
D3.js
Matplotlib
Tableau
TensorFlow
three.js
Data Analyst
Data Scientist
Data Visualizer
Service provided by
Muhammad Qadeer Nankana Sahib, Pakistan
A Map to show the traffic in USA Muhammad Qadeer
Starting at$20
Duration1 day
Tags
D3.js
Matplotlib
Tableau
TensorFlow
three.js
Data Analyst
Data Scientist
Data Visualizer
My project aims to provide a comprehensive analysis of traffic patterns in New York City using Python. By leveraging various data visualization libraries and real-time traffic data sources, the project will illustrate traffic density, congestion trends, and peak hours across different boroughs of NYC. Utilizing Python's powerful data processing capabilities, the project will employ tools such as Pandas for data manipulation, Matplotlib and Seaborn for plotting, and Folium for interactive maps. This analysis will not only highlight current traffic conditions but also offer insights into potential improvements and forecasting future traffic scenarios, ultimately contributing to more efficient urban planning and better traffic management strategies.
What's included
A proper report and The code plus the map image
In this project i will give you the source code with a properly documented pdf file and the map image of the USA that will show the traffic
FAQs
Muhammad 's other services
$20