
Data Visualizations to Drive Insights & DecisionsSaad Ahmad
I offer custom, interactive dashboards in Power BI or Tableau to uncover key insights from your data. Leveraging my background in data analytics, I design clear visuals and intuitive interfaces that empower informed decisions. My commitment to data storytelling sets me apart, ensuring you gain actionable insights and a strong competitive edge.
What's included
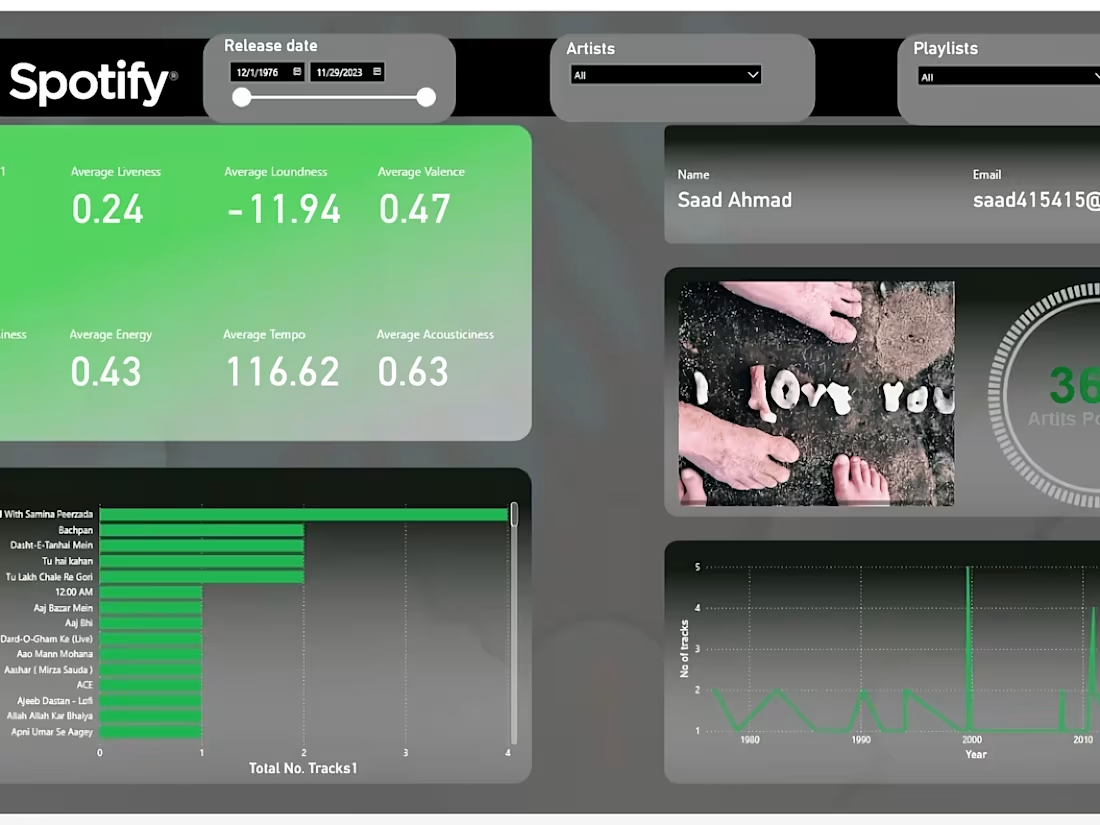
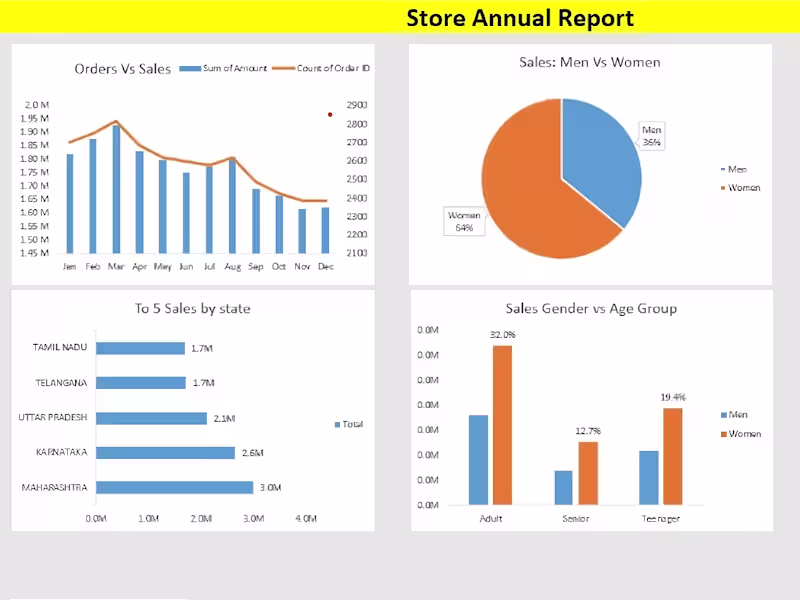
Interactive Power BI/Tableau Dashboard
A custom‐built, visually compelling dashboard (in either Power BI or Tableau) designed to highlight your key metrics and trends. It will include dynamic visuals, interactive filters, and clear data storytelling elements, enabling quick insights and data‐driven decisions.
Saad's other services
Starting at$25
Duration10 days
Tags
D3.js
Matplotlib
Tableau
TensorFlow
three.js
Data Analyst
Data Scientist
Data Visualizer
Service provided by
Saad Ahmad Nuremberg, Germany
- 1
- Followers
Data Visualizations to Drive Insights & DecisionsSaad Ahmad
Starting at$25
Duration10 days
Tags
D3.js
Matplotlib
Tableau
TensorFlow
three.js
Data Analyst
Data Scientist
Data Visualizer
I offer custom, interactive dashboards in Power BI or Tableau to uncover key insights from your data. Leveraging my background in data analytics, I design clear visuals and intuitive interfaces that empower informed decisions. My commitment to data storytelling sets me apart, ensuring you gain actionable insights and a strong competitive edge.
What's included
Interactive Power BI/Tableau Dashboard
A custom‐built, visually compelling dashboard (in either Power BI or Tableau) designed to highlight your key metrics and trends. It will include dynamic visuals, interactive filters, and clear data storytelling elements, enabling quick insights and data‐driven decisions.
Saad's other services
$25