
Power BI Performance Metrics Dashboards with Detailed InsightsFuad Gashi
This solution enables companies to monitor key metrics, analyze trends, and make data-driven decisions. With automated reporting and interactive visualizations, businesses can optimize operations, improve forecasting, and drive growth with clear, actionable insights.
What's included
What You Will Get
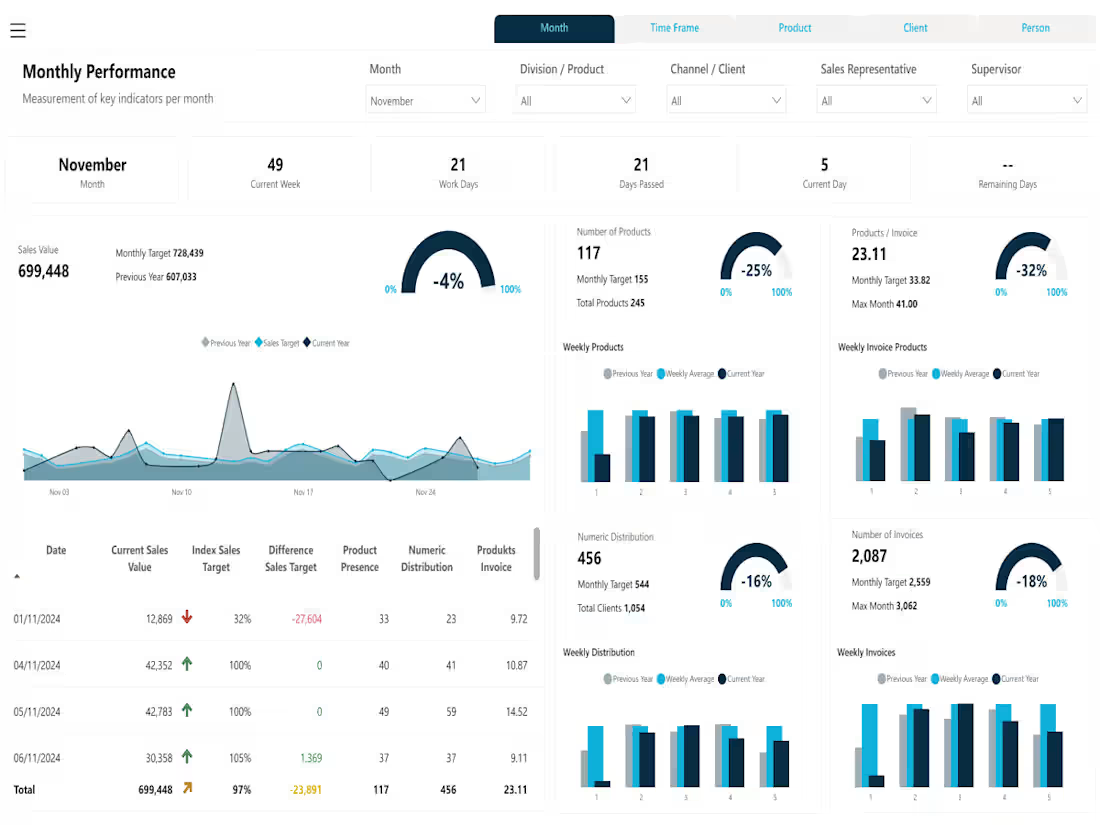
Developed a Power BI dashboard for real-time performance tracking, enabling businesses to monitor sales, customer behavior, products performance, sales representatives and distribution metrics.
The dashboard integrates multiple data sources, automates reporting, and provides interactive visualizations for faster decision-making.
Key Features
Sales & KPI Tracking – Monitor revenue, sales trends, and business performance.
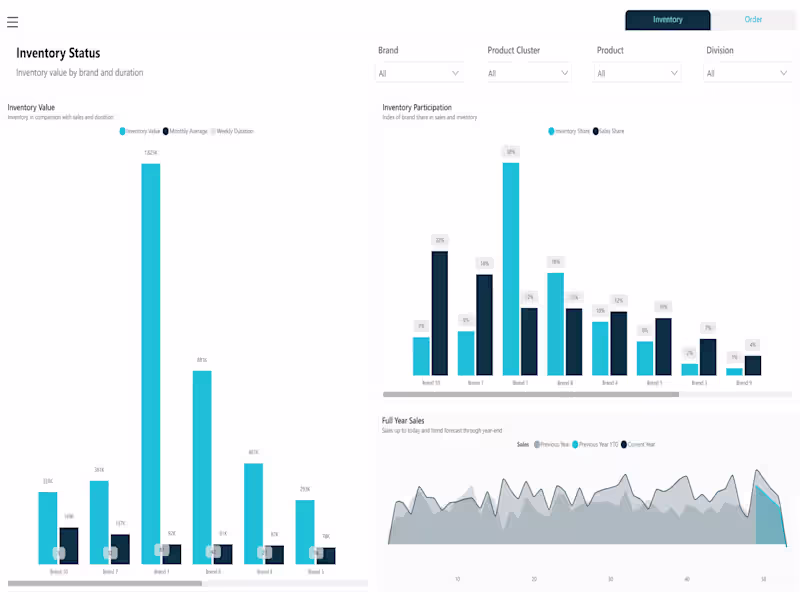
Product Distribution Analysis – Measure numeric distribution and product presence.
Automated Reporting – Reduce manual work with real-time data updates.
Interactive & User-Friendly – Easily filter and analyze key business insights.
This solution helps businesses improve efficiency, and make data-driven decisions with confidence.
This keeps it brief, clear, and client-focused, ensuring they quickly understand the value of the deliverable.
Fuad's other services
Starting at$25 /hr
Tags
Microsoft Power BI
Microsoft SQL Server
SQL
Business Analyst
Data Analyst
Data Visualizer
Service provided by
Fuad Gashi Serbia
Power BI Performance Metrics Dashboards with Detailed InsightsFuad Gashi
Starting at$25 /hr
Tags
Microsoft Power BI
Microsoft SQL Server
SQL
Business Analyst
Data Analyst
Data Visualizer
This solution enables companies to monitor key metrics, analyze trends, and make data-driven decisions. With automated reporting and interactive visualizations, businesses can optimize operations, improve forecasting, and drive growth with clear, actionable insights.
What's included
What You Will Get
Developed a Power BI dashboard for real-time performance tracking, enabling businesses to monitor sales, customer behavior, products performance, sales representatives and distribution metrics.
The dashboard integrates multiple data sources, automates reporting, and provides interactive visualizations for faster decision-making.
Key Features
Sales & KPI Tracking – Monitor revenue, sales trends, and business performance.
Product Distribution Analysis – Measure numeric distribution and product presence.
Automated Reporting – Reduce manual work with real-time data updates.
Interactive & User-Friendly – Easily filter and analyze key business insights.
This solution helps businesses improve efficiency, and make data-driven decisions with confidence.
This keeps it brief, clear, and client-focused, ensuring they quickly understand the value of the deliverable.
Fuad's other services
$25 /hr