
Data Visualization Rufael Anteneh
This is a customized data visualization service designed for brands and businesses seeking clear, impactful ways to present their data. Whether you need a one-time project or ongoing support, I’ll handle your data visualization needs—turning complex information into compelling visuals.
Sit back and relax while I transform your data into stories that inform, engage, and inspire. I’m here to bring your data to life, whenever you need it!
What's included
Custom Data Art
Creative, artistic representations of data for unique storytelling or branding.
Infographics
Clear, visually engaging graphics that simplify complex data and tell a story.
Geospatial Maps
Visual representations of location-based data for insights and decision-making.
Heatmaps
Color-coded visuals to highlight patterns, trends, and outliers in datasets.
Timeline Visualizations
Chronological displays that illustrate events, progress, or historical data.
Flow Diagrams
Visual pathways that explain processes, hierarchies, or relationships.
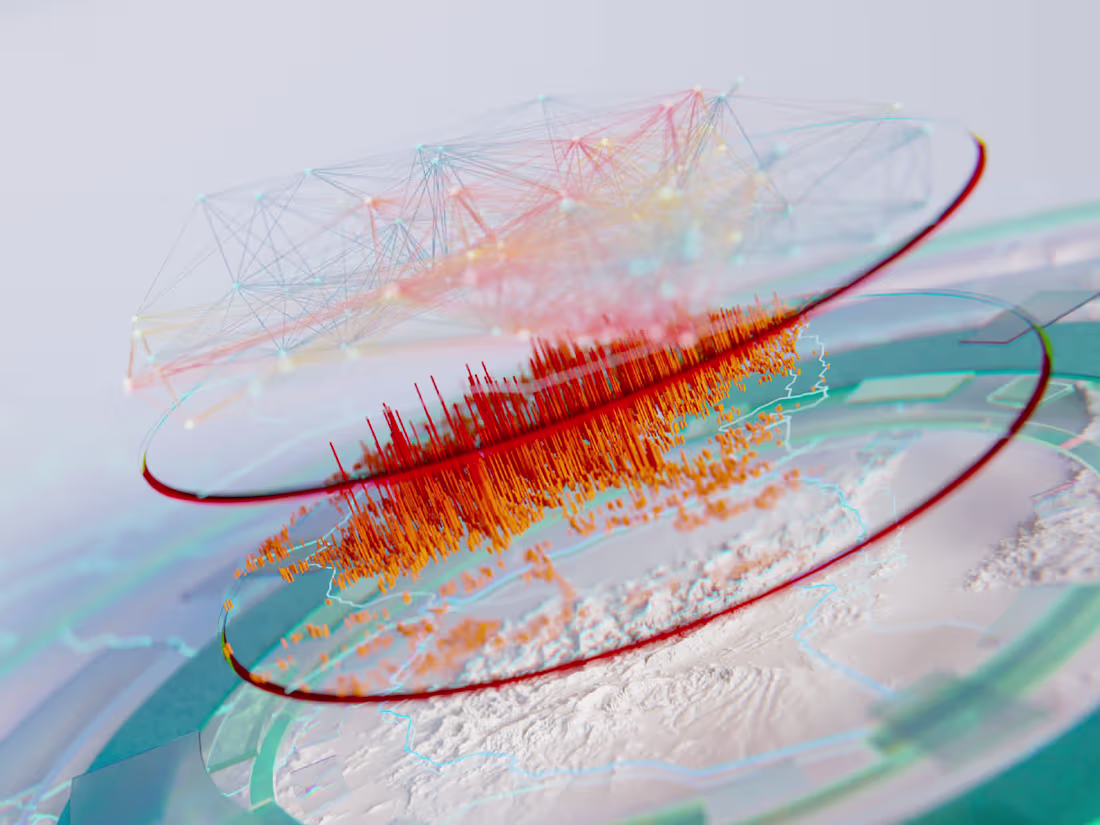
Example work


Contact for pricing
Tags
Blender
Data Visualizer
Service provided by
Rufael Anteneh Addis Ababa, Ethiopia
- 4
- Followers
Data Visualization Rufael Anteneh
Contact for pricing
Tags
Blender
Data Visualizer
This is a customized data visualization service designed for brands and businesses seeking clear, impactful ways to present their data. Whether you need a one-time project or ongoing support, I’ll handle your data visualization needs—turning complex information into compelling visuals.
Sit back and relax while I transform your data into stories that inform, engage, and inspire. I’m here to bring your data to life, whenever you need it!
What's included
Custom Data Art
Creative, artistic representations of data for unique storytelling or branding.
Infographics
Clear, visually engaging graphics that simplify complex data and tell a story.
Geospatial Maps
Visual representations of location-based data for insights and decision-making.
Heatmaps
Color-coded visuals to highlight patterns, trends, and outliers in datasets.
Timeline Visualizations
Chronological displays that illustrate events, progress, or historical data.
Flow Diagrams
Visual pathways that explain processes, hierarchies, or relationships.
Example work
Contact for pricing