
Maximize Your Real Estate Insights with Power BISai Kalari
I help real estate businesses transform property data into actionable insights using Power BI. From tracking sales performance and revenue trends to visualizing property locations and occupancy rates, I create dynamic dashboards tailored to your goals. What makes me unique is my ability to uncover growth opportunities by turning complex data into clear, strategic insights—empowering smarter, data-driven decisions.
What's included
Data-Driven Real Estate Solutions: Power BI Deliverables for Smarter Decision-Making.
Real Estate Power BI Project Deliverables:
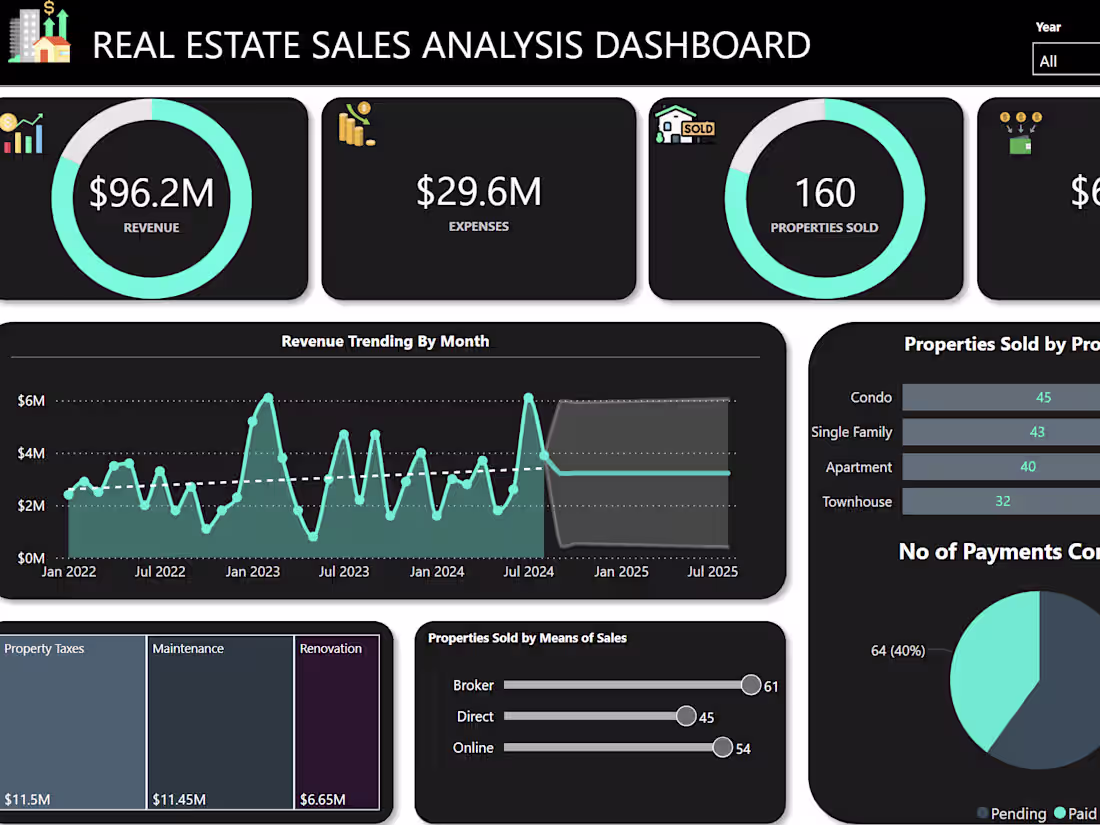
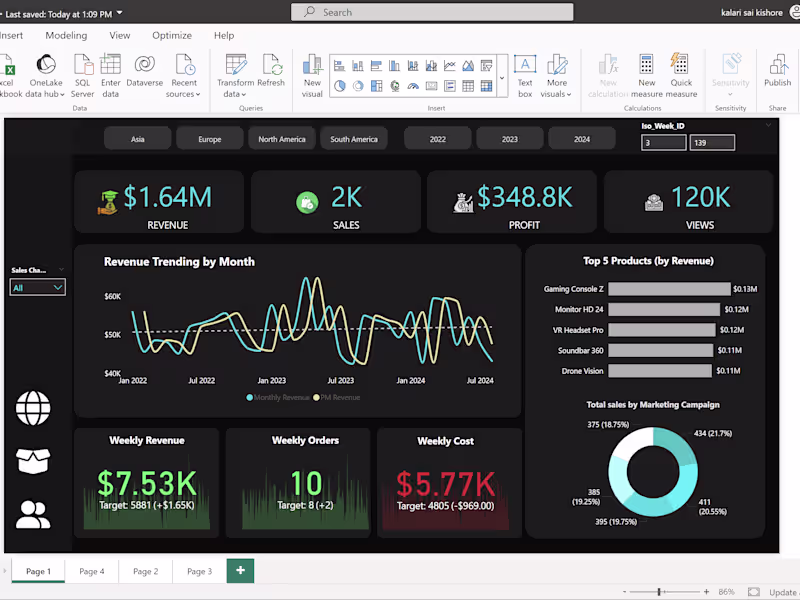
Interactive Power BI Dashboard — Tailored to real estate needs, featuring dynamic visuals and filters.
Key Performance Indicators (KPIs) — Metrics for revenue, property sales, occupancy rates, and more.
Data Model & DAX Measures — Structured data models with advanced DAX calculations for property performance analysis.
Data Source Integration — Connections to Excel, databases, or cloud platforms to streamline real estate data.
Reports & Visualizations — Line charts for revenue trends, bar graphs for property types, and maps for geographic insights.
Slicers & Filters — Interactive tools for exploring data by property type, location, and time period.
Automated Data Refresh — Scheduled updates to keep your data and insights current.
Documentation — Clear, easy-to-follow guides on dashboard functionality.
Sai's other services
Maximize Your Real Estate Insights with Power BISai Kalari
Starting at$20 /hr
Tags
Microsoft Power BI
Data Analyst
I help real estate businesses transform property data into actionable insights using Power BI. From tracking sales performance and revenue trends to visualizing property locations and occupancy rates, I create dynamic dashboards tailored to your goals. What makes me unique is my ability to uncover growth opportunities by turning complex data into clear, strategic insights—empowering smarter, data-driven decisions.
What's included
Data-Driven Real Estate Solutions: Power BI Deliverables for Smarter Decision-Making.
Real Estate Power BI Project Deliverables:
Interactive Power BI Dashboard — Tailored to real estate needs, featuring dynamic visuals and filters.
Key Performance Indicators (KPIs) — Metrics for revenue, property sales, occupancy rates, and more.
Data Model & DAX Measures — Structured data models with advanced DAX calculations for property performance analysis.
Data Source Integration — Connections to Excel, databases, or cloud platforms to streamline real estate data.
Reports & Visualizations — Line charts for revenue trends, bar graphs for property types, and maps for geographic insights.
Slicers & Filters — Interactive tools for exploring data by property type, location, and time period.
Automated Data Refresh — Scheduled updates to keep your data and insights current.
Documentation — Clear, easy-to-follow guides on dashboard functionality.
Sai's other services
$20 /hr