
Interactive Tableau Dashboard for Your Business KPIsYurii Cherevko
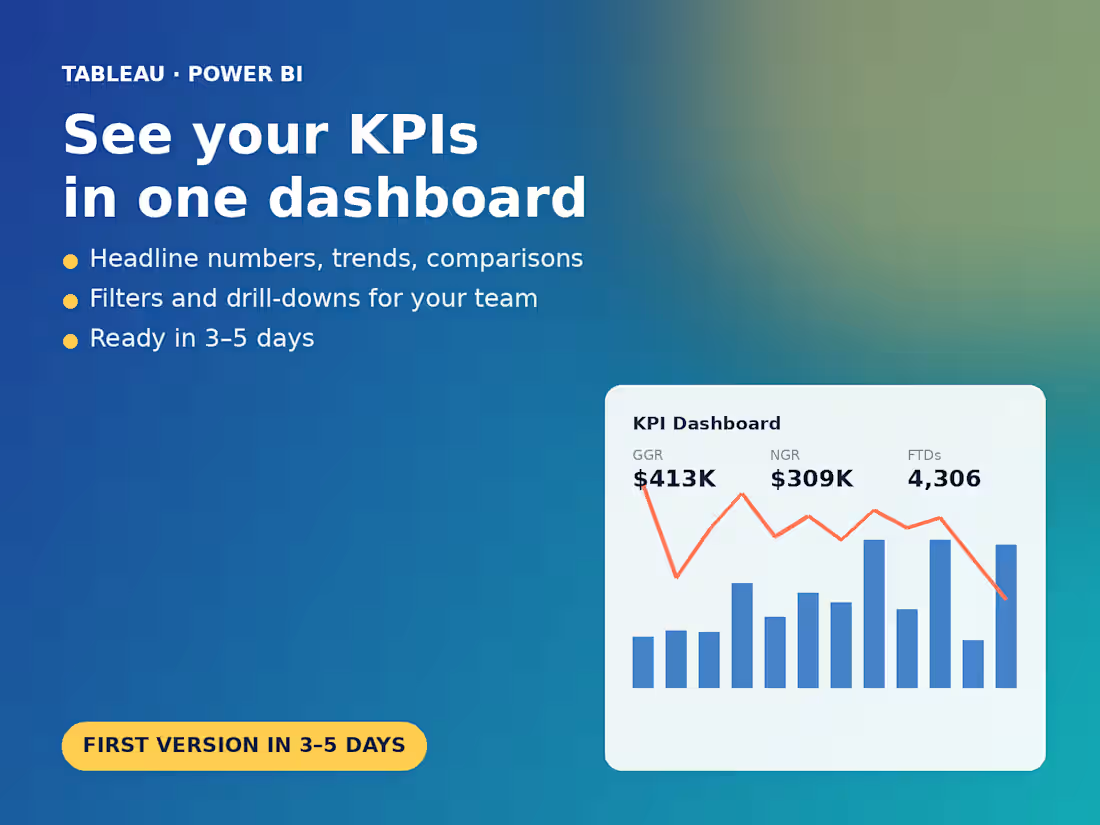
I build interactive Tableau dashboards that turn your raw data into one clear view of what is happening in your business: sales, marketing, finance, product or operations.
What you get
• KPI overview with headline numbers, trends and comparisons to the previous period
• Breakdowns by channel, product, region, customer segment or any dimension you need
• Filters, parameters and drill-downs so your team can explore the data themselves
• Clean, consistent design that is ready to share with management
• A short walkthrough of how the dashboard works and how to refresh it
How it works: send me your data (Excel, CSV, Google Sheets, a database export or a SQL connection) and a list of the questions the dashboard should answer. I propose a layout, build the first version within 3 to 5 days, and refine it with one or two rounds of feedback.
Background: 3 years as a Data Analyst in iGaming, e-commerce and digital marketing, building dashboards used daily by marketing, product, finance and management teams. Intro rate for first projects on Contra.
Starting at$120
Duration1 week
Tags
SQL

Tableau

Business Intelligence
Dashboard
Data Analyst
Data Visualizer
Service provided by
Yurii Cherevko Edmonton, Canada
- 1
- Followers
Interactive Tableau Dashboard for Your Business KPIsYurii Cherevko
Starting at$120
Duration1 week
Tags
SQL
Tableau
Business Intelligence
Dashboard
Data Analyst
Data Visualizer
I build interactive Tableau dashboards that turn your raw data into one clear view of what is happening in your business: sales, marketing, finance, product or operations.
What you get
• KPI overview with headline numbers, trends and comparisons to the previous period
• Breakdowns by channel, product, region, customer segment or any dimension you need
• Filters, parameters and drill-downs so your team can explore the data themselves
• Clean, consistent design that is ready to share with management
• A short walkthrough of how the dashboard works and how to refresh it
How it works: send me your data (Excel, CSV, Google Sheets, a database export or a SQL connection) and a list of the questions the dashboard should answer. I propose a layout, build the first version within 3 to 5 days, and refine it with one or two rounds of feedback.
Background: 3 years as a Data Analyst in iGaming, e-commerce and digital marketing, building dashboards used daily by marketing, product, finance and management teams. Intro rate for first projects on Contra.
$120