
Event Tracking and Reporting for AI-Powered ProductsUttam Kumaran
I design behavioral analytics systems for AI products that go beyond vanity metrics, capturing trust, satisfaction, and real outcomes. Using tools like Segment, PostHog, dbt, Snowflake, and Looker, I map the full AI user journey from input to result and build schemas, models, and dashboards that prove value. The result is a measurement layer that adapts as your prompts and workflows evolve, giving you clarity on what drives activation and retention.
What's included
Data Architecture Diagram
Clear map of how data flows across your tools, pipelines, and warehouse
Usage Metrics & Tracking Plan
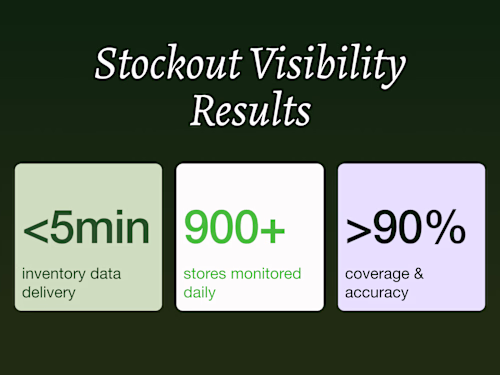
Defined events, funnels, and KPIs that measure AI value (activation, trust, outcomes)
Data platform documentation
Central reference of tools, pipelines, metrics, and owners
Analysis deck
Executive-ready insights on adoption, usage patterns, and business impact
6 month project plan
Phased plan for scaling tracking, models, and reporting
Analytics tool evaluation
Recommendations on Segment, PostHog, dbt, or BI tools to optimize your stack
Example work
Contact for pricing
Tags
Amplitude
dbt
Mixpanel
PostHog
Snowflake
Data Analyst
Data Modelling Analyst
Data Scientist
Service provided by
Uttam Kumaran Austin, USA
- 9
- Followers
Event Tracking and Reporting for AI-Powered ProductsUttam Kumaran
Contact for pricing
Tags
Amplitude
dbt
Mixpanel
PostHog
Snowflake
Data Analyst
Data Modelling Analyst
Data Scientist
I design behavioral analytics systems for AI products that go beyond vanity metrics, capturing trust, satisfaction, and real outcomes. Using tools like Segment, PostHog, dbt, Snowflake, and Looker, I map the full AI user journey from input to result and build schemas, models, and dashboards that prove value. The result is a measurement layer that adapts as your prompts and workflows evolve, giving you clarity on what drives activation and retention.
What's included
Data Architecture Diagram
Clear map of how data flows across your tools, pipelines, and warehouse
Usage Metrics & Tracking Plan
Defined events, funnels, and KPIs that measure AI value (activation, trust, outcomes)
Data platform documentation
Central reference of tools, pipelines, metrics, and owners
Analysis deck
Executive-ready insights on adoption, usage patterns, and business impact
6 month project plan
Phased plan for scaling tracking, models, and reporting
Analytics tool evaluation
Recommendations on Segment, PostHog, dbt, or BI tools to optimize your stack
Example work
Contact for pricing