
Data Visualization & Infographic DesignKarmanya Kaur
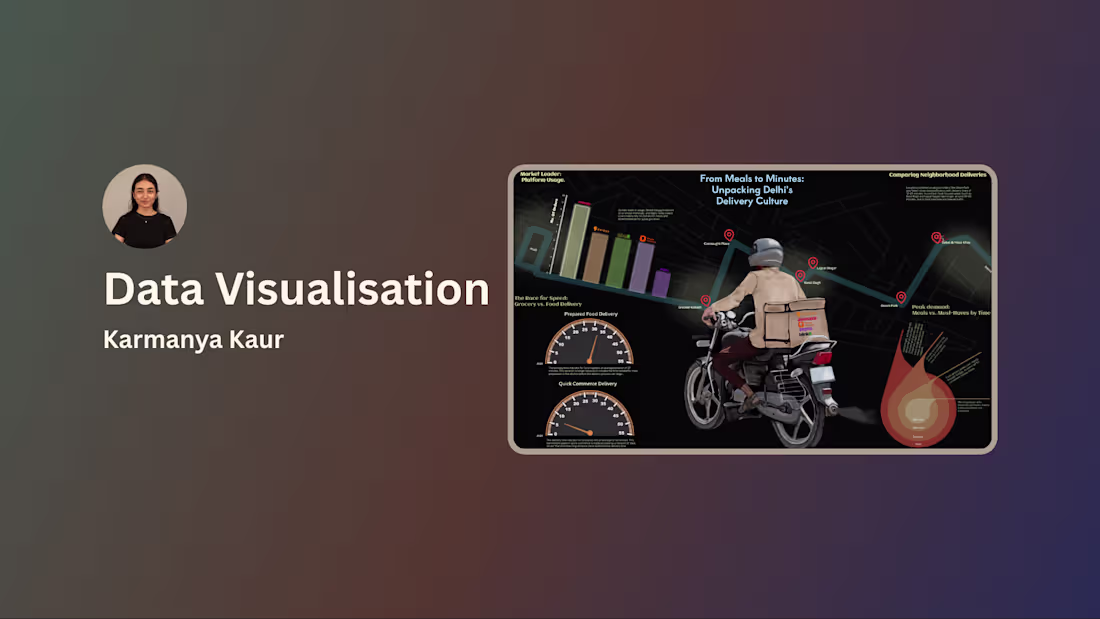
I design clear, engaging, and visually compelling data visualizations that transform complex information into easy-to-understand visual narratives. Whether you need infographic posters, research-based visual storytelling, presentation graphics, or interactive-style layouts, I focus on balancing accuracy, clarity, and strong visual structure.
My process begins with understanding your data, objectives, and target audience. I analyze patterns, identify key insights, and translate them into structured compositions using typography, hierarchy, color systems, and layout principles. The goal is not just to present data, but to communicate meaning effectively.
This service is ideal for startups, researchers, students, brands, and organizations looking to present reports, insights, or statistics in a way that is informative, aesthetically refined, and impactful.
Deliverables include high-resolution digital files suitable for web, print, or presentations.
FAQs
Karmanya's other services
Contact for pricing
Duration1 week
Tags
Adobe Illustrator
Framer
Communication Designer
Data Visualizer
Infographic Designer
Visual Designer
visual storytelling
Service provided by
Karmanya Kaur Delhi, India
Data Visualization & Infographic DesignKarmanya Kaur
Contact for pricing
Duration1 week
Tags
Adobe Illustrator
Framer
Communication Designer
Data Visualizer
Infographic Designer
Visual Designer
visual storytelling
I design clear, engaging, and visually compelling data visualizations that transform complex information into easy-to-understand visual narratives. Whether you need infographic posters, research-based visual storytelling, presentation graphics, or interactive-style layouts, I focus on balancing accuracy, clarity, and strong visual structure.
My process begins with understanding your data, objectives, and target audience. I analyze patterns, identify key insights, and translate them into structured compositions using typography, hierarchy, color systems, and layout principles. The goal is not just to present data, but to communicate meaning effectively.
This service is ideal for startups, researchers, students, brands, and organizations looking to present reports, insights, or statistics in a way that is informative, aesthetically refined, and impactful.
Deliverables include high-resolution digital files suitable for web, print, or presentations.
FAQs
Karmanya's other services
Contact for pricing