
Data Analytics & Visualizationshirshadip samajder
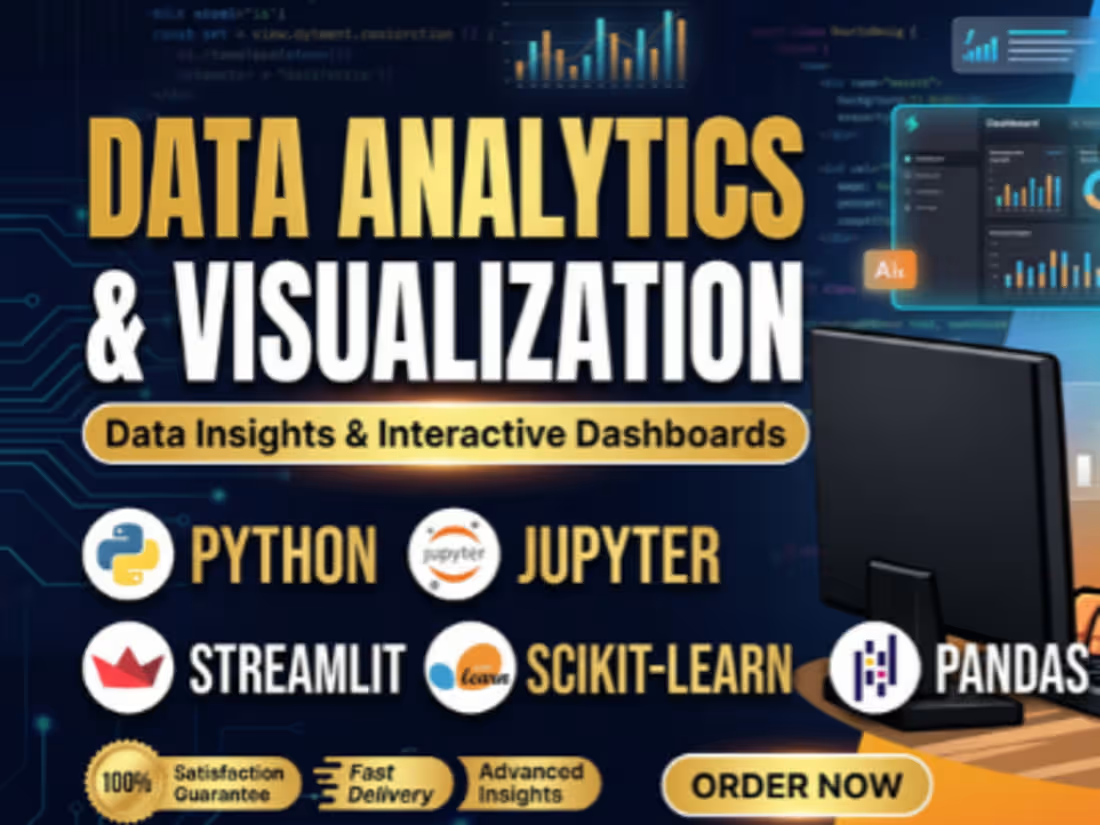
Data Analytics & Visualization
Turn your raw data into clear, actionable insights.
I help businesses, researchers, students, and individuals clean, analyze, and visualize their data to uncover meaningful trends, patterns, and insights.
Whether you have a messy Excel spreadsheet or a large CSV dataset, I can transform it into a structured and understandable analysis.
What I can help with
Data cleaning and preprocessing
Exploratory Data Analysis (EDA)
Statistical analysis
Missing-value and duplicate handling
Outlier detection
Trend and pattern analysis
Data visualization
Correlation and relationship analysis
Summary statistics
Business and research insights
Excel data analysis
Python-based data analysis
Tools
Python
Pandas
NumPy
Matplotlib
Seaborn
Jupyter Notebook
Other
Microsoft Excel
CSV / XLSX
What you'll receive
📊 Clean and structured data
📈 Professional data visualizations
🔎 Exploratory analysis and findings
💡 Clear interpretation of important insights
🐍 Well-organized Python/Jupyter Notebook when applicable
📋 A concise summary of the results
Types of projects
I can work with:
Sales & revenue data
Customer data
Marketing datasets
Survey data
E-commerce data
Financial datasets
Academic/research data
Business datasets
Experimental data
My approach
Understand → Clean → Explore → Analyze → Visualize → Interpret
I don't just generate charts. I focus on understanding the structure of your data and communicating the findings in a way that is clear, useful, and reproducible.
Let's work together
Have a dataset that you want to understand better?
Send me your data and project requirements, and let's turn your data into insights.
FAQs


Contact for pricing
Duration1 week
Tags
Jupyter

Matplotlib
pandas

Tableau

Business Analyst
Business Strategist
Mathematician
Service provided by
shirshadip samajder Panihati, India
- 17
- Followers
Data Analytics & Visualizationshirshadip samajder
Contact for pricing
Duration1 week
Tags
Jupyter
Matplotlib
pandas
Tableau
Business Analyst
Business Strategist
Mathematician
Data Analytics & Visualization
Turn your raw data into clear, actionable insights.
I help businesses, researchers, students, and individuals clean, analyze, and visualize their data to uncover meaningful trends, patterns, and insights.
Whether you have a messy Excel spreadsheet or a large CSV dataset, I can transform it into a structured and understandable analysis.
What I can help with
Data cleaning and preprocessing
Exploratory Data Analysis (EDA)
Statistical analysis
Missing-value and duplicate handling
Outlier detection
Trend and pattern analysis
Data visualization
Correlation and relationship analysis
Summary statistics
Business and research insights
Excel data analysis
Python-based data analysis
Tools
Python
Pandas
NumPy
Matplotlib
Seaborn
Jupyter Notebook
Other
Microsoft Excel
CSV / XLSX
What you'll receive
📊 Clean and structured data
📈 Professional data visualizations
🔎 Exploratory analysis and findings
💡 Clear interpretation of important insights
🐍 Well-organized Python/Jupyter Notebook when applicable
📋 A concise summary of the results
Types of projects
I can work with:
Sales & revenue data
Customer data
Marketing datasets
Survey data
E-commerce data
Financial datasets
Academic/research data
Business datasets
Experimental data
My approach
Understand → Clean → Explore → Analyze → Visualize → Interpret
I don't just generate charts. I focus on understanding the structure of your data and communicating the findings in a way that is clear, useful, and reproducible.
Let's work together
Have a dataset that you want to understand better?
Send me your data and project requirements, and let's turn your data into insights.
FAQs
Contact for pricing