
Python Data Analysis and VisualizationSrijan Devnath
My main offerings are -
First a complete analysis of your data using Python which includes data cleaning and transformations, data visualization using matplotlib and seaborn, trend and predictive analysis using ML algorithms.
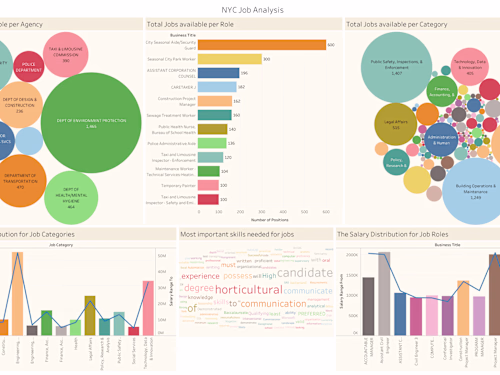
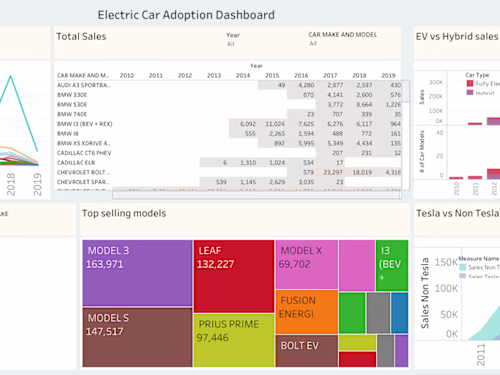
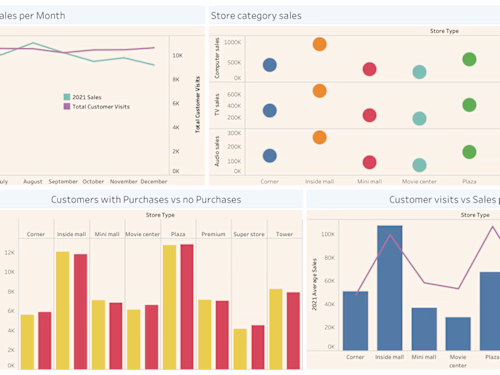
Secondly using Python libraries like Matplotlib, Seaborn I will make accurate visualizations using important parameters obtained from the first step. This includes using Bar Charts, Box and Whisker Plots, Pie Charts, Trend Lines and much more all with accurate filtering, labelling and parameter selection.
The final result is a dashboard provided with all the different charts and the Python source code for the initial analysis delivered within a day or two.
What's included
Source Code
I will be providing the source code containing all the visualizations, libraries imported in a well commented clean format over Jupyter Notebook or .py files
Srijan's other services

Contact for pricing
Tags
Python
Data Analyst
Data Scientist
Data Visualizer
Service provided by
Srijan Devnath Bengaluru, India
Python Data Analysis and VisualizationSrijan Devnath
Contact for pricing
Tags
Python
Data Analyst
Data Scientist
Data Visualizer
My main offerings are -
First a complete analysis of your data using Python which includes data cleaning and transformations, data visualization using matplotlib and seaborn, trend and predictive analysis using ML algorithms.
Secondly using Python libraries like Matplotlib, Seaborn I will make accurate visualizations using important parameters obtained from the first step. This includes using Bar Charts, Box and Whisker Plots, Pie Charts, Trend Lines and much more all with accurate filtering, labelling and parameter selection.
The final result is a dashboard provided with all the different charts and the Python source code for the initial analysis delivered within a day or two.
What's included
Source Code
I will be providing the source code containing all the visualizations, libraries imported in a well commented clean format over Jupyter Notebook or .py files
Srijan's other services
Contact for pricing