
Dashboard & Reporting Creation and DesignJoy Z
I tame wild spreadsheets and datasets for a living, the kind with millions of rows and tabs named “Final_final_v8_REAL.” My superpower is turning the complex into user-friendly reports that makes sense even to those who don't like Excel.
What's included
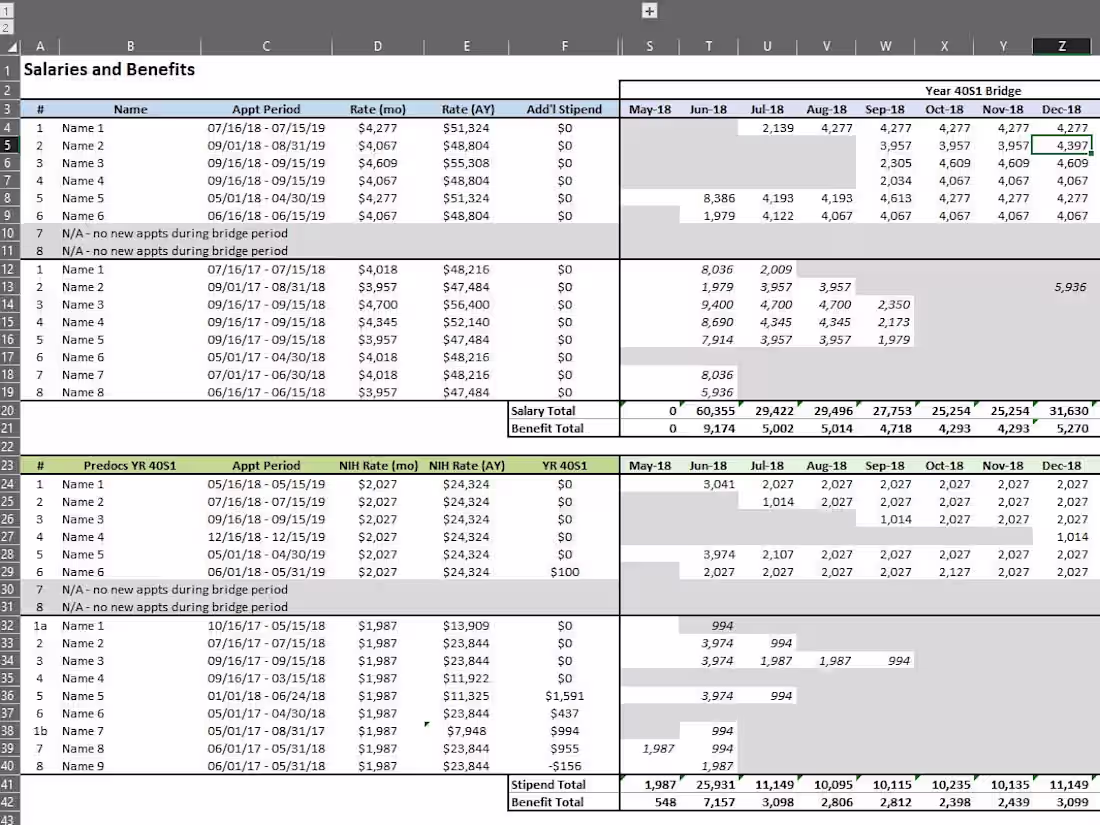
Custom KPI Dashboard/Report in Excel or Google Sheets
Deliverable includes: a set of custom-built dashboard or report in Excel or Google Sheets. This includes automated summaries and visual charts for quick insights, clearly structured tabs for inputs and calculations, consistent formatting, color-coding, and navigation for ease of use, and a step-by-step instructions for updating and maintaining the file.
Outcome: A polished, reliable reporting tool that turns your raw data into actionable insights, tailored to your specific business goals.
FAQs
Starting at$50 /hr
Tags
Google Sheets
Microsoft Excel
Financial Analyst
Financial Consultant
Service provided by
Joy Z Seattle, USA
- 2
- Followers
Dashboard & Reporting Creation and DesignJoy Z
Starting at$50 /hr
Tags
Google Sheets
Microsoft Excel
Financial Analyst
Financial Consultant
I tame wild spreadsheets and datasets for a living, the kind with millions of rows and tabs named “Final_final_v8_REAL.” My superpower is turning the complex into user-friendly reports that makes sense even to those who don't like Excel.
What's included
Custom KPI Dashboard/Report in Excel or Google Sheets
Deliverable includes: a set of custom-built dashboard or report in Excel or Google Sheets. This includes automated summaries and visual charts for quick insights, clearly structured tabs for inputs and calculations, consistent formatting, color-coding, and navigation for ease of use, and a step-by-step instructions for updating and maintaining the file.
Outcome: A polished, reliable reporting tool that turns your raw data into actionable insights, tailored to your specific business goals.
FAQs
$50 /hr