
Data Visualization & Dashboard CreationGeta Viasu-Räisänen
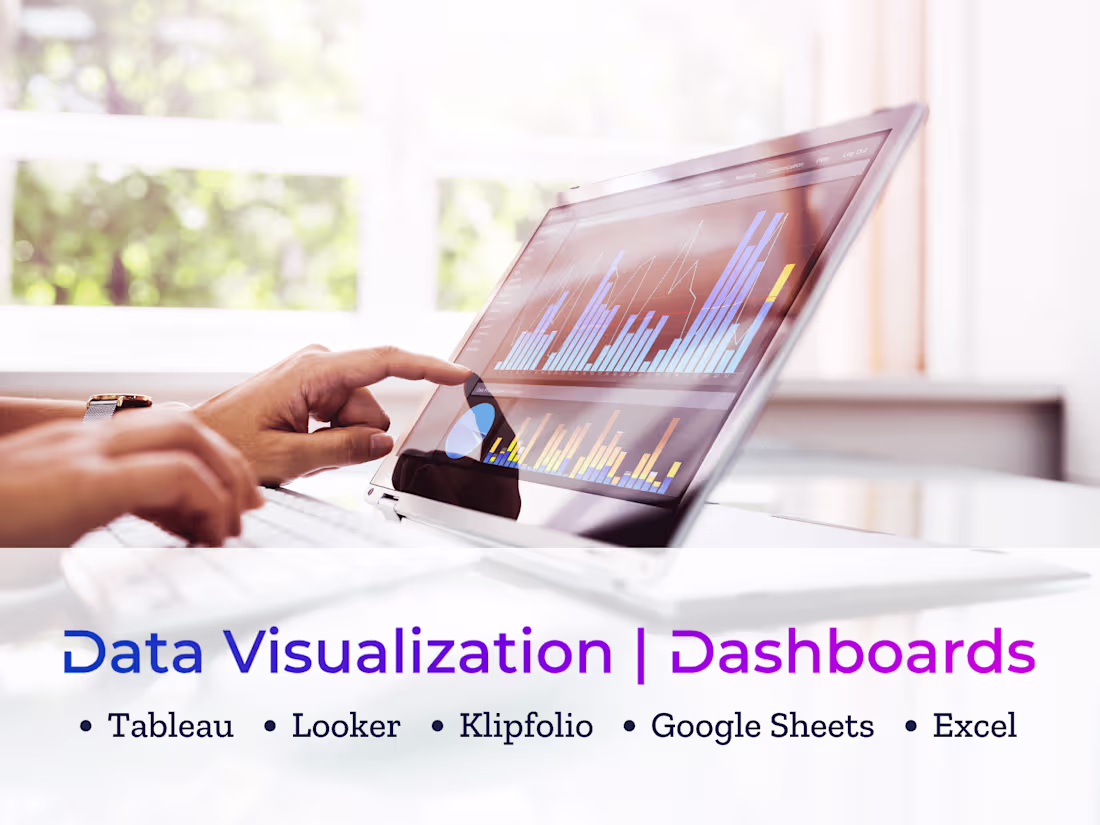
I create dynamic, user-friendly dashboards that turn raw data into clear, actionable insights. With 7+ years of experience in BI and data visualization, I specialize in making complex data easy to understand through intuitive design and storytelling. Whether you need a fresh dashboard built from scratch or an existing one optimized, I ensure every visualization drives real business impact.
What's included
Scope Definition
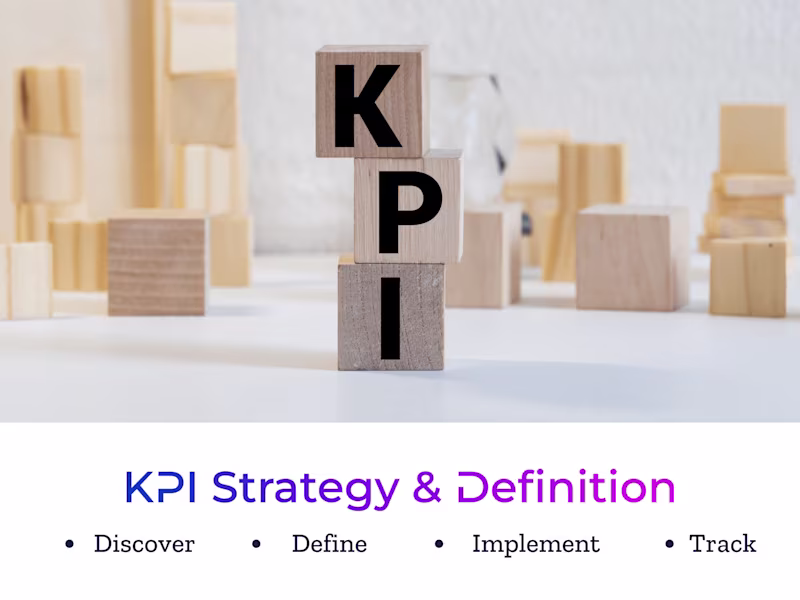
We kick off with a 45-minute strategy call to clarify the dashboard’s scope, stakeholders, and key business questions it needs to answer. We’ll cover:
- Essential KPIs & metrics to track
- Time granularity and reporting frequency
- Data sources, availability, and health
- Tools & tech stack (Tableau, Looker, Google Sheets, etc.)
I’ll consolidate all findings into a shared project document to ensure alignment before moving forward.
Data Assesment
Once I gain access to the relevant data sources, I’ll perform a data quality assessment to verify that all agreed-upon KPIs can be accurately built. This includes:
- Identifying gaps or inconsistencies in the data
- Ensuring data integrity & readiness for visualization
- Flagging potential limitations before development
The findings will be documented in the shared project document, and if needed, I’ll provide recommendations on improving data structure.
Dashboard Creation & Revisions
With validated data and clear KPIs, I’ll build a dynamic, interactive dashboard that transforms raw numbers into actionable insights.
🔄 Two Rounds of Revisions:
1️⃣ First Review – When the dashboard structure is ready, you’ll provide feedback on layout, usability, and initial data representation.
2️⃣ Final Review – Once the dashboard is complete, you can request minor refinements (up to 60 minutes of work).
Final deliverables will be shared in your chosen tool (Tableau, Looker, or Google Sheets) with a brief walkthrough session if needed.
Geta's other services
Starting at$52 /hr
Tags
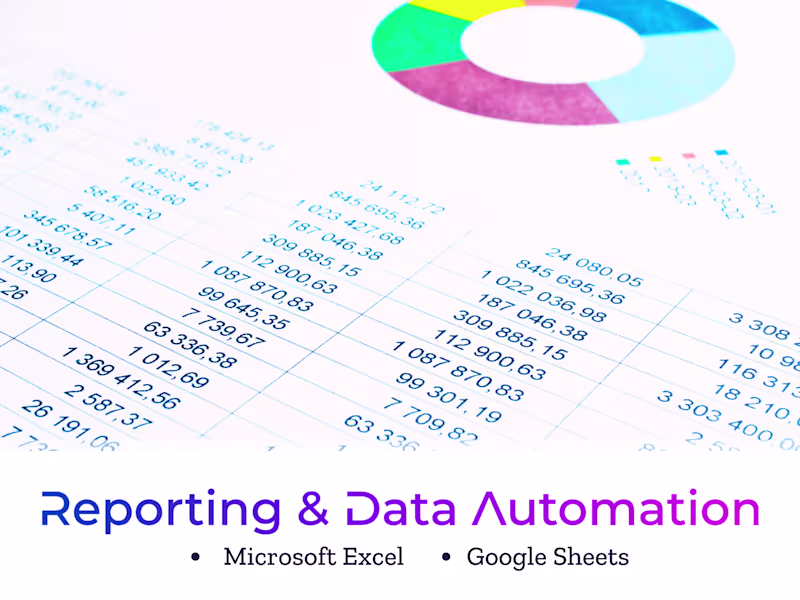
Google Sheets
Klipfolio
Looker
Microsoft Excel
Tableau
Data Analyst
Data Visualizer
Product Analyst
Service provided by
Geta Viasu-Räisänen Timișoara, Romania
- 8
- Followers
Data Visualization & Dashboard CreationGeta Viasu-Räisänen
Starting at$52 /hr
Tags
Google Sheets
Klipfolio
Looker
Microsoft Excel
Tableau
Data Analyst
Data Visualizer
Product Analyst
I create dynamic, user-friendly dashboards that turn raw data into clear, actionable insights. With 7+ years of experience in BI and data visualization, I specialize in making complex data easy to understand through intuitive design and storytelling. Whether you need a fresh dashboard built from scratch or an existing one optimized, I ensure every visualization drives real business impact.
What's included
Scope Definition
We kick off with a 45-minute strategy call to clarify the dashboard’s scope, stakeholders, and key business questions it needs to answer. We’ll cover:
- Essential KPIs & metrics to track
- Time granularity and reporting frequency
- Data sources, availability, and health
- Tools & tech stack (Tableau, Looker, Google Sheets, etc.)
I’ll consolidate all findings into a shared project document to ensure alignment before moving forward.
Data Assesment
Once I gain access to the relevant data sources, I’ll perform a data quality assessment to verify that all agreed-upon KPIs can be accurately built. This includes:
- Identifying gaps or inconsistencies in the data
- Ensuring data integrity & readiness for visualization
- Flagging potential limitations before development
The findings will be documented in the shared project document, and if needed, I’ll provide recommendations on improving data structure.
Dashboard Creation & Revisions
With validated data and clear KPIs, I’ll build a dynamic, interactive dashboard that transforms raw numbers into actionable insights.
🔄 Two Rounds of Revisions:
1️⃣ First Review – When the dashboard structure is ready, you’ll provide feedback on layout, usability, and initial data representation.
2️⃣ Final Review – Once the dashboard is complete, you can request minor refinements (up to 60 minutes of work).
Final deliverables will be shared in your chosen tool (Tableau, Looker, or Google Sheets) with a brief walkthrough session if needed.
Geta's other services
$52 /hr