
I Will transform Your Data: Clean, Sequence, Visualize itZulqarnain Haider
Experienced professional specializing in data cleaning, analysis, and visualization. I create dynamic dashboards in Excel and Power BI, turning raw data into actionable insights. Let’s streamline your data for smarter decision-making and impactful results!
What's included
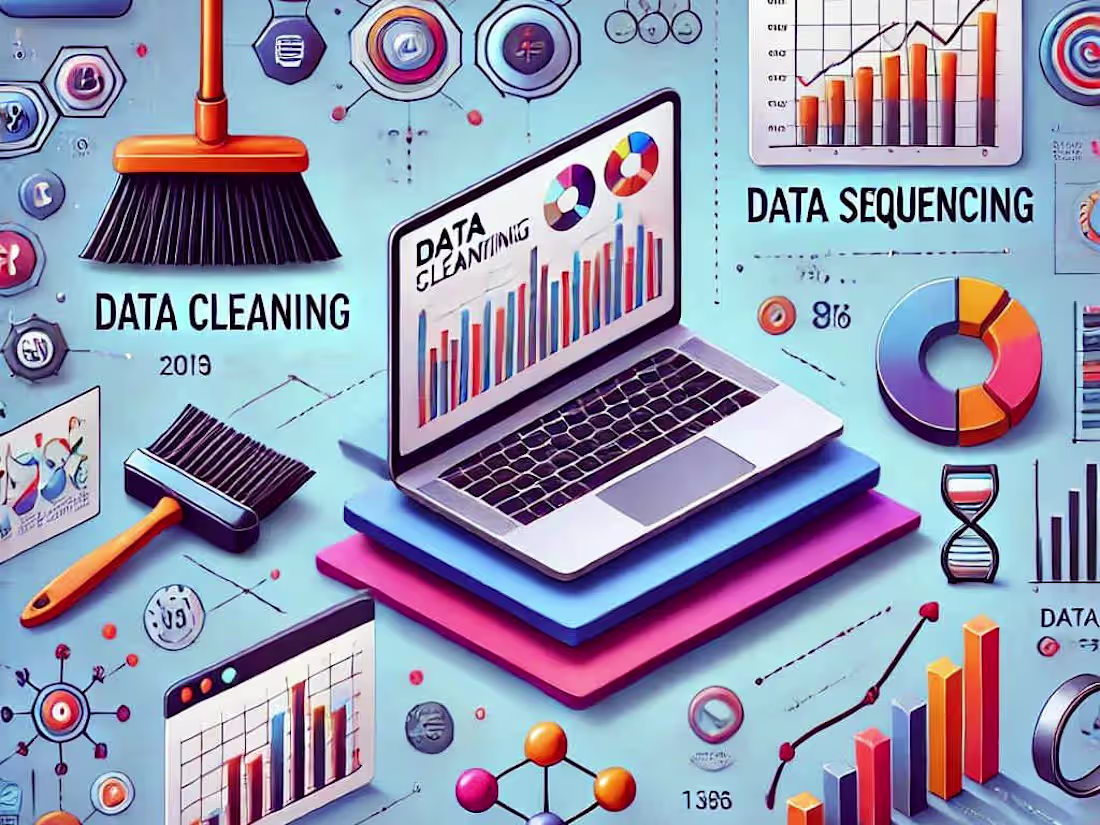
Data Cleaning, Sequencing, Analysis & Dashboard
Data cleaning, sequencing, and analysis, transforming raw data into actionable insights. Designed interactive dashboards in Excel and Power BI, enabling data-driven decisions and streamlined reporting. Let’s elevate your data!
FAQs
Zulqarnain's other services
Starting at$20 /hr
Tags
Microsoft Excel
Microsoft Power BI
Tableau
Data Analyst
Data Modelling Analyst
Data Scientist
Service provided by
Zulqarnain Haider Lahore, Pakistan
I Will transform Your Data: Clean, Sequence, Visualize itZulqarnain Haider
Starting at$20 /hr
Tags
Microsoft Excel
Microsoft Power BI
Tableau
Data Analyst
Data Modelling Analyst
Data Scientist
Experienced professional specializing in data cleaning, analysis, and visualization. I create dynamic dashboards in Excel and Power BI, turning raw data into actionable insights. Let’s streamline your data for smarter decision-making and impactful results!
What's included
Data Cleaning, Sequencing, Analysis & Dashboard
Data cleaning, sequencing, and analysis, transforming raw data into actionable insights. Designed interactive dashboards in Excel and Power BI, enabling data-driven decisions and streamlined reporting. Let’s elevate your data!
FAQs
Zulqarnain's other services
$20 /hr