
Data Analysis & Dashboard Design (Tableau|Power BI|Python)Ifigeneia Tsiflidou
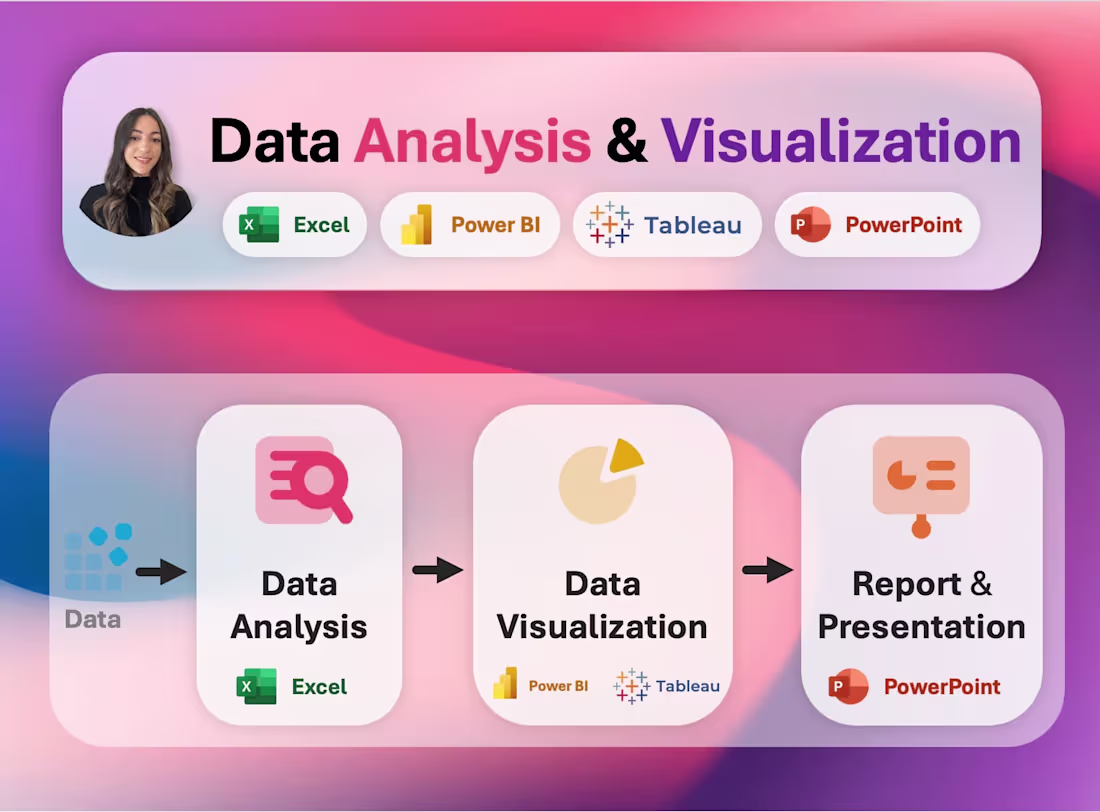
I design clear, insightful dashboards and visual reports using Tableau, Power BI, and Python. Whether you’re working with Excel data or complex datasets, I’ll turn your numbers into meaningful visuals that support decision-making. My work is clean, interactive, and tailored to your goals.
What's included
Interactive Dashboard (Tableau / Power BI / Python)
A fully functional, interactive dashboard visualizing your key metrics using your chosen tool (Tableau, Power BI, or Python). Includes filters, charts, KPIs, and clear layout design.
Excel Data Transformed into Visual Dashboard
Convert your Excel data into a visual dashboard, highlighting trends and insights with charts, slicers, and summary visuals. Output in Tableau, Power BI, or Python (Jupyter Notebook).
Custom Visual Report / Presentation
Deliver a visual report or presentation (PowerPoint or PDF) summarizing your data with clean charts, graphs, and data storytelling based on your business needs.
Starting at$20 /hr
Tags
Matplotlib
Microsoft Power BI
Microsoft PowerPoint
Python
Tableau
Data Analyst
Data Scientist
Data Visualizer
Service provided by
Ifigeneia Tsiflidou The Hague, Netherlands
- 8
- Followers
Data Analysis & Dashboard Design (Tableau|Power BI|Python)Ifigeneia Tsiflidou
Starting at$20 /hr
Tags
Matplotlib
Microsoft Power BI
Microsoft PowerPoint
Python
Tableau
Data Analyst
Data Scientist
Data Visualizer
I design clear, insightful dashboards and visual reports using Tableau, Power BI, and Python. Whether you’re working with Excel data or complex datasets, I’ll turn your numbers into meaningful visuals that support decision-making. My work is clean, interactive, and tailored to your goals.
What's included
Interactive Dashboard (Tableau / Power BI / Python)
A fully functional, interactive dashboard visualizing your key metrics using your chosen tool (Tableau, Power BI, or Python). Includes filters, charts, KPIs, and clear layout design.
Excel Data Transformed into Visual Dashboard
Convert your Excel data into a visual dashboard, highlighting trends and insights with charts, slicers, and summary visuals. Output in Tableau, Power BI, or Python (Jupyter Notebook).
Custom Visual Report / Presentation
Deliver a visual report or presentation (PowerPoint or PDF) summarizing your data with clean charts, graphs, and data storytelling based on your business needs.
$20 /hr