
Dashboard & Analytics Design for SaaS and EnterpriseMohsin Khalid
Most dashboards fail silently — not because they look bad, but because teams make the wrong decisions with the right data. I design dashboards built for real decisions: information structured around what users need to act on, not just what the database can show.
Who This Is For
Companies running data-heavy platforms where decisions have real consequences:
Fintech reporting and transaction dashboards
Enterprise analytics and operational systems
Multi-role admin platforms
Marketplace seller tools
Investment and portfolio dashboards
If your current dashboard has 50+ metrics with no hierarchy, reports your team exports to Excel, or decision-makers asking "what does this number mean?" — you're in the right place.
Proven At Scale
Data-heavy platforms I've designed include:
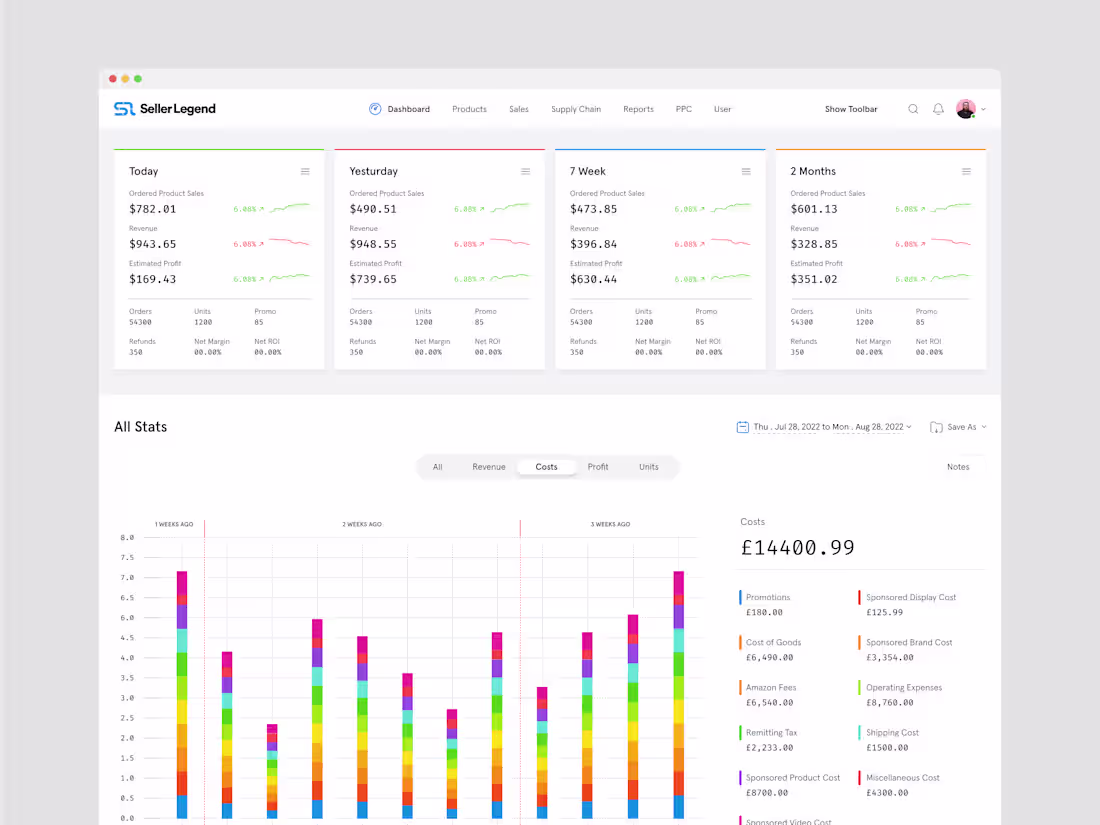
SellerLegend — SaaS analytics for Amazon sellers managing $100M+ in revenue
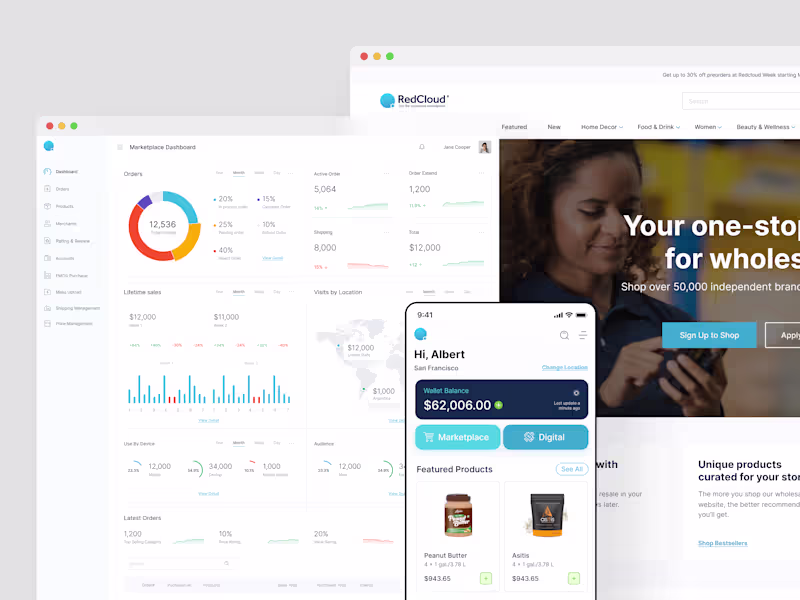
RedCloud — Multi-role B2B dashboards for payments, inventory, and trade
Siemens — Enterprise medical systems with regulatory reporting
Manafa Capital — Fintech investment dashboards for retail and institutional investors
What's Included
Full data and workflow audit
Decision-first information architecture
Multi-role view design (admin, analyst, executive, operator)
Dashboard layouts with real data visualization
Complete state design (loading, empty, error, real-time)
Responsive web and tablet designs
Component library for dashboard patterns
Engineering-ready handoff
Process
Week 1: Audit, user interviews across roles, backend data review
Week 2–3: Information architecture, role-based views, decision hierarchy
Week 4–5: Dashboard designs, data visualization, component system
Week 6: Full responsive design, state handling
Week 7–8: Design system, engineering handoff
Typical engagement: 6–10 weeks
What's NOT Included
Backend data modeling
Custom data visualization engineering
User research panels
Frontend development
Investment
$50/hour
Typical projects: 6–10 weeks, 120–200 hours
Minimum engagement: 60 hours
FAQs

Starting at$50 /hr
Tags
Figma
Notion
Data Visualizer
Product Designer
UI Designer
UX Designer
Visual System Designer
Service provided by
Mohsin Khalid Lahore, Pakistan
- 1
- Followers
Dashboard & Analytics Design for SaaS and EnterpriseMohsin Khalid
Starting at$50 /hr
Tags
Figma
Notion
Data Visualizer
Product Designer
UI Designer
UX Designer
Visual System Designer
Most dashboards fail silently — not because they look bad, but because teams make the wrong decisions with the right data. I design dashboards built for real decisions: information structured around what users need to act on, not just what the database can show.
Who This Is For
Companies running data-heavy platforms where decisions have real consequences:
Fintech reporting and transaction dashboards
Enterprise analytics and operational systems
Multi-role admin platforms
Marketplace seller tools
Investment and portfolio dashboards
If your current dashboard has 50+ metrics with no hierarchy, reports your team exports to Excel, or decision-makers asking "what does this number mean?" — you're in the right place.
Proven At Scale
Data-heavy platforms I've designed include:
SellerLegend — SaaS analytics for Amazon sellers managing $100M+ in revenue
RedCloud — Multi-role B2B dashboards for payments, inventory, and trade
Siemens — Enterprise medical systems with regulatory reporting
Manafa Capital — Fintech investment dashboards for retail and institutional investors
What's Included
Full data and workflow audit
Decision-first information architecture
Multi-role view design (admin, analyst, executive, operator)
Dashboard layouts with real data visualization
Complete state design (loading, empty, error, real-time)
Responsive web and tablet designs
Component library for dashboard patterns
Engineering-ready handoff
Process
Week 1: Audit, user interviews across roles, backend data review
Week 2–3: Information architecture, role-based views, decision hierarchy
Week 4–5: Dashboard designs, data visualization, component system
Week 6: Full responsive design, state handling
Week 7–8: Design system, engineering handoff
Typical engagement: 6–10 weeks
What's NOT Included
Backend data modeling
Custom data visualization engineering
User research panels
Frontend development
Investment
$50/hour
Typical projects: 6–10 weeks, 120–200 hours
Minimum engagement: 60 hours
FAQs
$50 /hr