
Data AnalyticsDUSHYANT SHUKLA
I provide comprehensive data analysis services, including cleaning, visualizing, and modeling data to drive better decisions. What sets me apart is my ability to tailor solutions to specific business needs, delivering clear and impactful results with a focus on actionable recommendations and interactive reporting tools.
What's included
Data Cleaning Report, Data Profiling Report, Analytical Report, Data Visualization, Presentation, Project Summary, Custom Reports and Dashboards
The deliverables expected from the client at the end of any data analysis project can be as follows:
1. Data Cleaning Report
- Report on errors in the data, near misses, and missing data.
- Details of data cleaning methods and transformations used.
2. Data Profiling Report
- Summary of overall statistics of the data (e.g.: mean, median, mode, distribution, etc.).
- Characteristics of various features of the data and their distribution.
3. Analytical Report
- Answers to the project objectives and analytical questions.
- Findings and interpretations based on the information.
- Data driven insights for business/decision making.
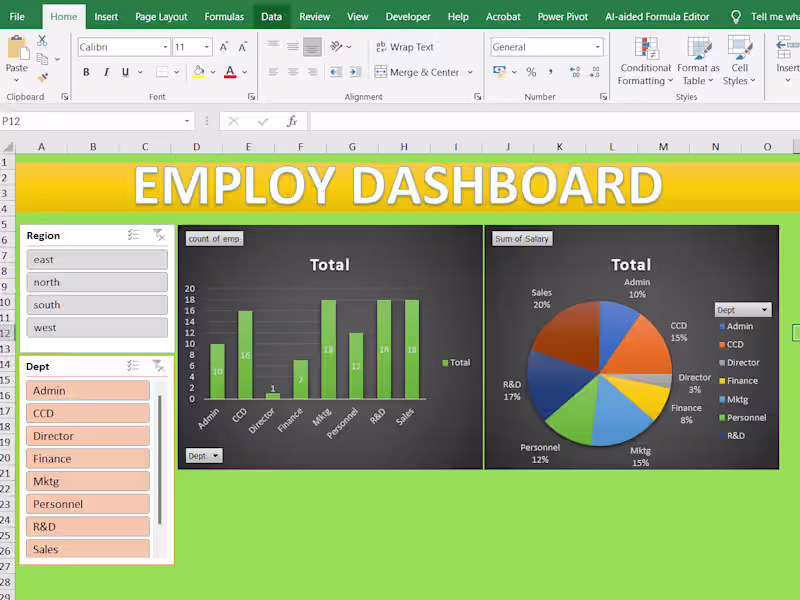
4. Data Visualization
- Charts, graphs, and dashboards that clearly represent data and findings.
- Visual representation of key statistics related to the analysis (e.g.: bar charts, pie charts, line graphs, heatmaps, etc.)
5. Presentation
- A concise and engaging presentation to the client that includes key findings and recommendations.
- These presentations are typically shared at board meetings or with decision-makers.
6. Project Summary
- A summary of the key aspects of the project from start to finish, including objectives, methodology, results, and conclusions.
7. Custom Reports and Dashboards
- Custom reports or interactive dashboards created to suit specific client needs.
- These reports help clients easily perform real-time analysis of data.
The list of these deliverables will depend on the client’s requirements, project complexity, and type, but in general these deliverables are provided at the end of a data analysis project.
DUSHYANT's other services

Starting at$25 /hr
Tags
Microsoft Excel
Microsoft Power BI
Microsoft PowerPoint
Data Modelling Analyst
Product Data Analyst
Service provided by
DUSHYANT SHUKLA Moradabad, India
Data AnalyticsDUSHYANT SHUKLA
Starting at$25 /hr
Tags
Microsoft Excel
Microsoft Power BI
Microsoft PowerPoint
Data Modelling Analyst
Product Data Analyst
I provide comprehensive data analysis services, including cleaning, visualizing, and modeling data to drive better decisions. What sets me apart is my ability to tailor solutions to specific business needs, delivering clear and impactful results with a focus on actionable recommendations and interactive reporting tools.
What's included
Data Cleaning Report, Data Profiling Report, Analytical Report, Data Visualization, Presentation, Project Summary, Custom Reports and Dashboards
The deliverables expected from the client at the end of any data analysis project can be as follows:
1. Data Cleaning Report
- Report on errors in the data, near misses, and missing data.
- Details of data cleaning methods and transformations used.
2. Data Profiling Report
- Summary of overall statistics of the data (e.g.: mean, median, mode, distribution, etc.).
- Characteristics of various features of the data and their distribution.
3. Analytical Report
- Answers to the project objectives and analytical questions.
- Findings and interpretations based on the information.
- Data driven insights for business/decision making.
4. Data Visualization
- Charts, graphs, and dashboards that clearly represent data and findings.
- Visual representation of key statistics related to the analysis (e.g.: bar charts, pie charts, line graphs, heatmaps, etc.)
5. Presentation
- A concise and engaging presentation to the client that includes key findings and recommendations.
- These presentations are typically shared at board meetings or with decision-makers.
6. Project Summary
- A summary of the key aspects of the project from start to finish, including objectives, methodology, results, and conclusions.
7. Custom Reports and Dashboards
- Custom reports or interactive dashboards created to suit specific client needs.
- These reports help clients easily perform real-time analysis of data.
The list of these deliverables will depend on the client’s requirements, project complexity, and type, but in general these deliverables are provided at the end of a data analysis project.
DUSHYANT's other services
$25 /hr