
Interactive Power BI Dashboard for Financial DataSaransh Purohit
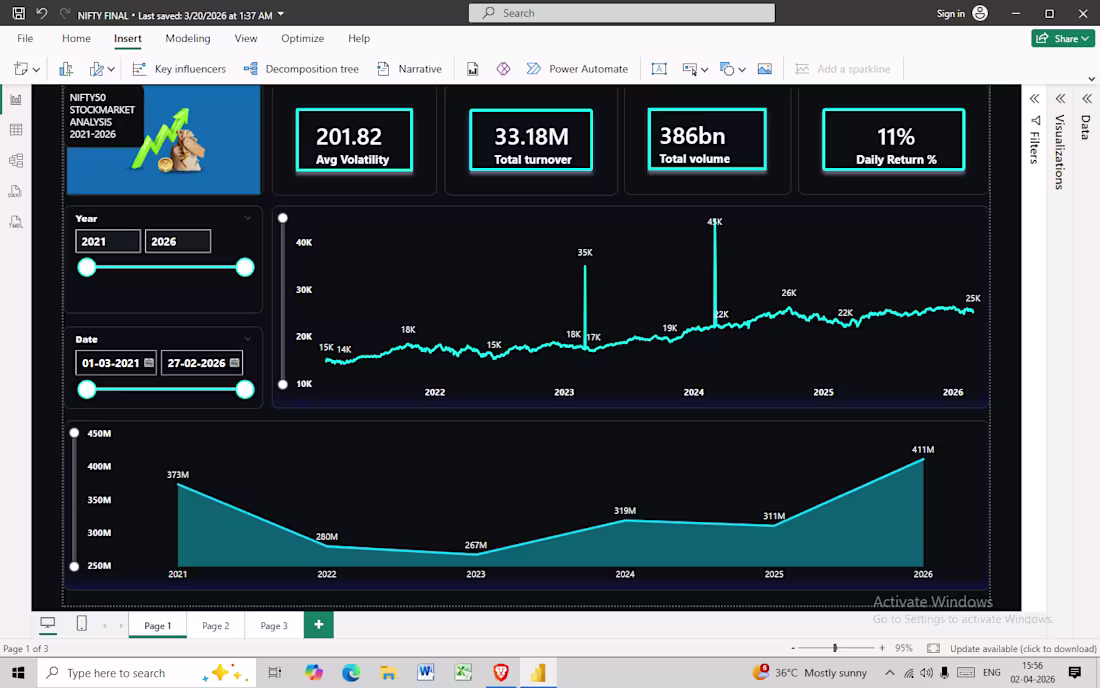
will transform your complex financial datasets into high-impact, interactive Power BI dashboards. Whether it’s stock market data, sales reports, or expense tracking, I provide visual clarity to help you make data-driven decisions.
What you will get:
Custom Dashboard: Multi-page interactive report with drill-down features.
DAX Measures: Complex calculations for Year-over-Year (YoY) growth, Moving Averages, and KPIs.
Data Cleaning: Professional ETL (Extract, Transform, Load) using Power Query.
Clean Design: A professional layout that follows UI/UX best practices for data storytelling.
Starting at$10
Duration2 days
Tags
Microsoft Power BI
SQL
Service provided by
Saransh Purohit Delhi, India
Interactive Power BI Dashboard for Financial DataSaransh Purohit
Starting at$10
Duration2 days
Tags
Microsoft Power BI
SQL
will transform your complex financial datasets into high-impact, interactive Power BI dashboards. Whether it’s stock market data, sales reports, or expense tracking, I provide visual clarity to help you make data-driven decisions.
What you will get:
Custom Dashboard: Multi-page interactive report with drill-down features.
DAX Measures: Complex calculations for Year-over-Year (YoY) growth, Moving Averages, and KPIs.
Data Cleaning: Professional ETL (Extract, Transform, Load) using Power Query.
Clean Design: A professional layout that follows UI/UX best practices for data storytelling.
$10