
Mission Moon — Power BI Dashboard | Data VisualizationPankaj Kumar Maury
Explore humanity's race to the Moon with this immersive Power BI dashboard. Covering 1958 to 2023, it combines rich historical data with a bold cosmic visual design — making it perfect as a portfolio piece, a learning reference, or a ready-to-present space analytics report.
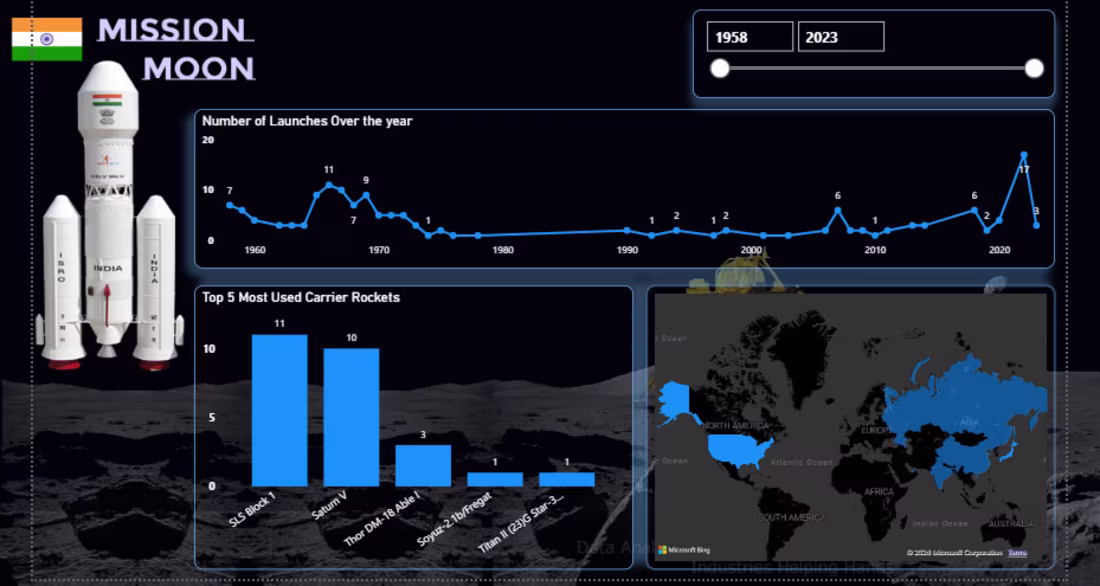
What's included:
Launch trend line chart with labeled peak mission years
Top 5 carrier rockets bar chart (SLS Block I, Saturn V, Thor DM-18, Soyuz, Titan II)
Global map visual showing participating countries by mission count
Year slicer for fully interactive data filtering
Custom space-themed UI with lunar background, ISRO rocket imagery, and sci-fi typography
My expertise:
I specialize in building visually compelling, story-driven Power BI dashboards that go beyond plain charts. I combine strong data modeling (DAX, relationships, calculated measures) with thoughtful UI/UX design — so every dashboard I build is both analytically accurate and presentation-ready. Whether you need a sleek executive report, an industry-specific analytics page, or a creative themed dashboard, I deliver work that stands out.
Starting at$11
Duration1 week
Tags
Dashboard
Data Analyst
Data Analyst
Data Modelling Analyst
Data Visualizer
PowerBI
Microsoft PowerBI
UI/UX Designe
Visualization
Service provided by
Pankaj Kumar Maury New Delhi, India
Mission Moon — Power BI Dashboard | Data VisualizationPankaj Kumar Maury
Starting at$11
Duration1 week
Tags
Dashboard
Data Analyst
Data Analyst
Data Modelling Analyst
Data Visualizer
PowerBI
Microsoft PowerBI
UI/UX Designe
Visualization
Explore humanity's race to the Moon with this immersive Power BI dashboard. Covering 1958 to 2023, it combines rich historical data with a bold cosmic visual design — making it perfect as a portfolio piece, a learning reference, or a ready-to-present space analytics report.
What's included:
Launch trend line chart with labeled peak mission years
Top 5 carrier rockets bar chart (SLS Block I, Saturn V, Thor DM-18, Soyuz, Titan II)
Global map visual showing participating countries by mission count
Year slicer for fully interactive data filtering
Custom space-themed UI with lunar background, ISRO rocket imagery, and sci-fi typography
My expertise:
I specialize in building visually compelling, story-driven Power BI dashboards that go beyond plain charts. I combine strong data modeling (DAX, relationships, calculated measures) with thoughtful UI/UX design — so every dashboard I build is both analytically accurate and presentation-ready. Whether you need a sleek executive report, an industry-specific analytics page, or a creative themed dashboard, I deliver work that stands out.
$11