
From Data to Strategy: Tailored Analysis for Business GrowthDeep Patel
I offer advanced predictive modeling solutions that leverage cutting-edge machine learning algorithms to forecast trends and outcomes with high accuracy. What sets me apart is my ability to integrate vast datasets seamlessly and provide real-time, actionable insights tailored to your specific needs. This ensures you stay ahead of the curve in a rapidly changing environment.
What's included
Data Cleaning and Preparation
Removing duplicates, handling missing values, and ensuring data consistency to prepare datasets for analysis. Cleaned and well-structured datasets ready for Predictive analysis.
Exploratory Data Analysis (EDA)
Conducting initial investigations on data to discover patterns, spot anomalies, and test hypotheses. An EDA report with visualizations and insights about the data
Predictive Modeling
Building models to predict future outcomes based on historical data using techniques like regression, classification, and time series analysis.
Predictive models and a report detailing the model’s performance and insights
Segmentation Analysis
Dividing a dataset into distinct groups based on specific criteria to identify patterns and target different segments effectively.
A segmentation report with detailed profiles of each segment.
Hypothesis Testing
Conducting statistical tests to determine if there is enough evidence to support a specific hypothesis about the data. A hypothesis testing report with results and interpretations.
Correlation and Causation Analysis
Identifying relationships between variables and determining if changes in one variable cause changes in another. A report detailing the correlations and potential causal relationships within the data.
Customized Data Solutions
Tailoring data analysis services to meet specific business needs, such as market analysis, customer behavior analysis, or operational efficiency analysis. Customized reports and solutions based on the specific requirements of the business.
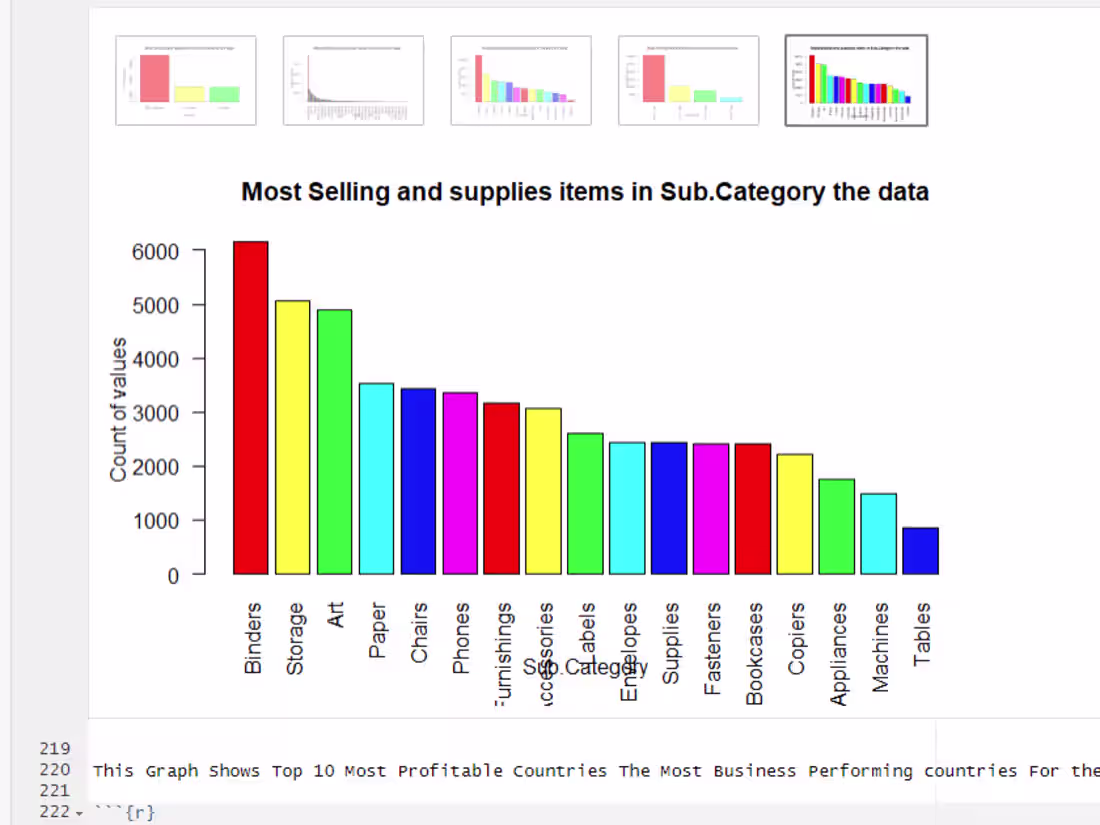
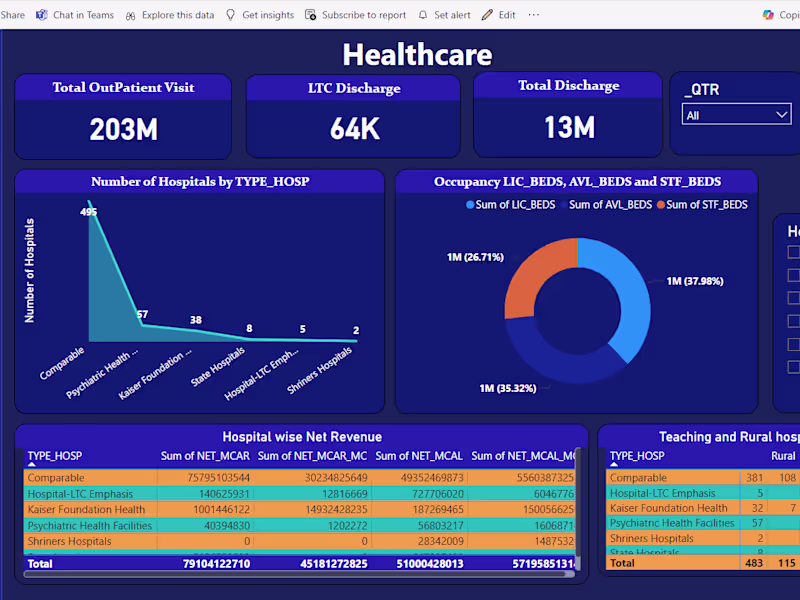
Data Visualization
Creating charts, graphs, and dashboards to visually represent data trends and patterns. Interactive dashboards and visualizations using Power BI
Deep's other services
Starting at$20
Duration1 week
Tags
Microsoft Excel
pandas
Python
SQL
Data Analyst
Data Modelling Analyst
Data Scientist
Service provided by
Deep Patel Kent, USA
From Data to Strategy: Tailored Analysis for Business GrowthDeep Patel
Starting at$20
Duration1 week
Tags
Microsoft Excel
pandas
Python
SQL
Data Analyst
Data Modelling Analyst
Data Scientist
I offer advanced predictive modeling solutions that leverage cutting-edge machine learning algorithms to forecast trends and outcomes with high accuracy. What sets me apart is my ability to integrate vast datasets seamlessly and provide real-time, actionable insights tailored to your specific needs. This ensures you stay ahead of the curve in a rapidly changing environment.
What's included
Data Cleaning and Preparation
Removing duplicates, handling missing values, and ensuring data consistency to prepare datasets for analysis. Cleaned and well-structured datasets ready for Predictive analysis.
Exploratory Data Analysis (EDA)
Conducting initial investigations on data to discover patterns, spot anomalies, and test hypotheses. An EDA report with visualizations and insights about the data
Predictive Modeling
Building models to predict future outcomes based on historical data using techniques like regression, classification, and time series analysis.
Predictive models and a report detailing the model’s performance and insights
Segmentation Analysis
Dividing a dataset into distinct groups based on specific criteria to identify patterns and target different segments effectively.
A segmentation report with detailed profiles of each segment.
Hypothesis Testing
Conducting statistical tests to determine if there is enough evidence to support a specific hypothesis about the data. A hypothesis testing report with results and interpretations.
Correlation and Causation Analysis
Identifying relationships between variables and determining if changes in one variable cause changes in another. A report detailing the correlations and potential causal relationships within the data.
Customized Data Solutions
Tailoring data analysis services to meet specific business needs, such as market analysis, customer behavior analysis, or operational efficiency analysis. Customized reports and solutions based on the specific requirements of the business.
Data Visualization
Creating charts, graphs, and dashboards to visually represent data trends and patterns. Interactive dashboards and visualizations using Power BI
Deep's other services
$20