
Transforming Numbers into Insights with Artful Visualization

Starting at
$
50
About this service
Summary
we offer bespoke data visualization services that transform complex datasets into clear, interactive dashboards and compelling visual stories. What sets us apart is our unique blend of artistic design and data expertise, creating visually stunning and highly functional tools that make data-driven insights both accessible and actionable for you.
Process
The project journey begins with an initial consultation to grasp your goals and data needs. Next, I assess the data's quality and structure, followed by creating a detailed design proposal for the visualizations. Once approved, I prepare and clean the data, then develop interactive dashboards and visualizations. After rigorous testing and refinement to ensure functionality, I deliver the final product and provide comprehensive training for effective use. Ongoing support and maintenance are then offered to adapt to any future needs and keep the visualizations relevant.
What's included
Customizable Dashboard
Interactive and user-friendly dashboards tailored to your specific needs, allowing for real-time data monitoring and insights.
Detailed Data Visualizations
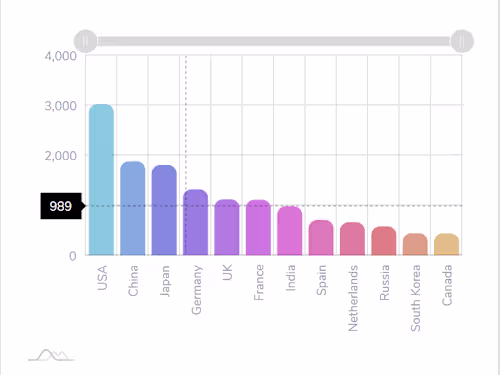
High-quality charts, graphs, and infographics designed to present your data clearly and compellingly, highlighting key trends and patterns.
Data Analysis Report
: A comprehensive report summarizing the findings, insights, and recommendations derived from your data, presented in an easy-to-understand format.
Duration
9 days
Skills and tools
Data Scientist
Data Visualizer
Data Analyst

Matplotlib

Microsoft Power BI

Tableau
More services