
Creative and clean Dashboards to brig your data to life. Arthur Rincon de Freitas
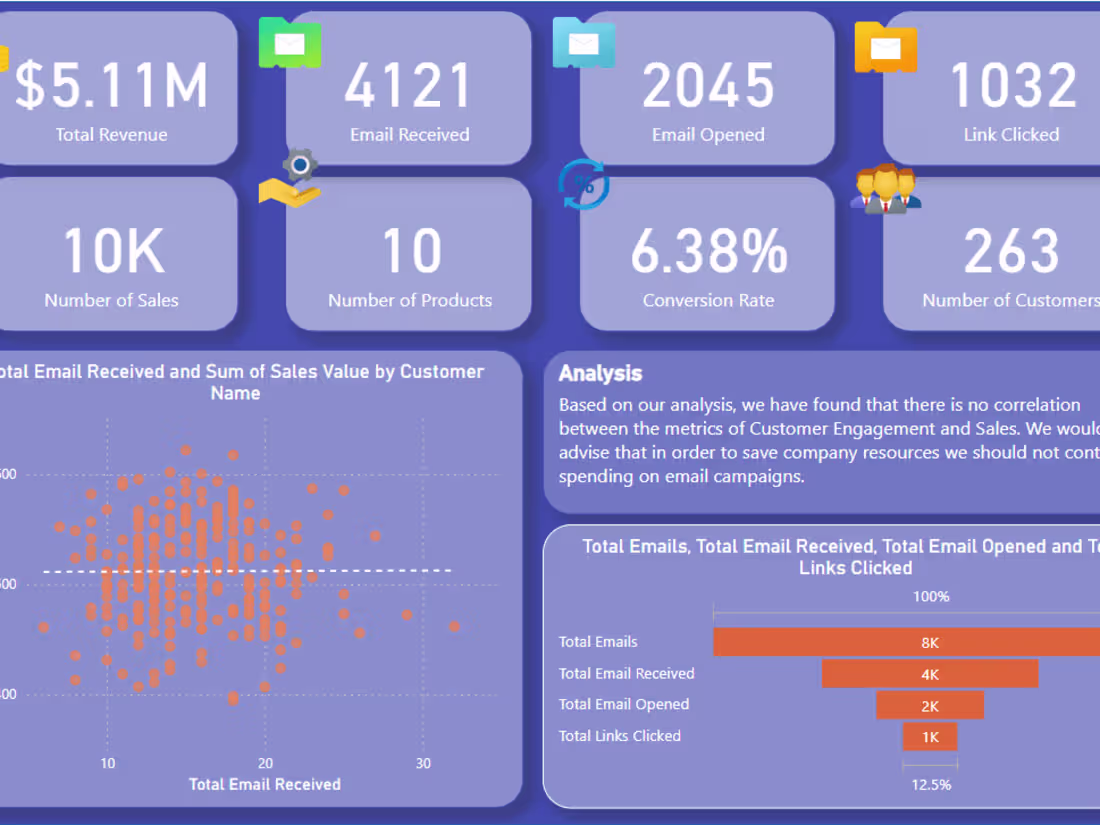
I offer custom interactive dashboards and data visualization solutions that transform complex data into clear, actionable insights. Utilizing top tools like Tableau and Power BI, I ensure user-friendly designs tailored to your specific business needs. My unique approach combines a deep understanding of data with a focus on intuitive user experience, ensuring that your team can easily navigate and leverage the insights for strategic decision-making.
What's included
Custom Interactive Dashboards and Data Visualization Solutions
1. Initial Consultation and Requirement Analysis:
* One-on-one consultation to understand your business needs, goals, and data sources.
* Detailed requirement gathering and documentation to ensure alignment with your objectives.
2. Data Integration and Preparation:
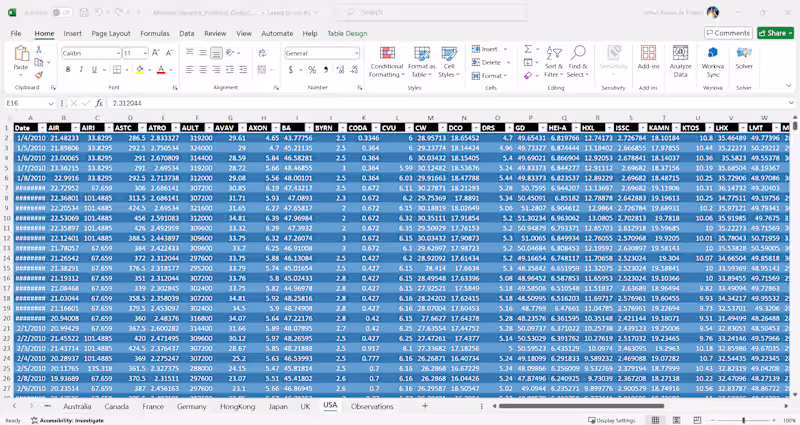
* Collection and integration of data from various sources (e.g., databases, spreadsheets, APIs).
* Data cleaning, transformation, and preparation to ensure accuracy and consistency.
3. Dashboard Design and Development:
* Custom-designed dashboards tailored to your specific needs and preferences.
* Development of interactive and user-friendly visualizations using tools like Tableau, Power BI, or Google Data Studio.
4. Key Performance Indicators (KPIs) and Metrics Setup:
* Identification and implementation of relevant KPIs and metrics.
* Real-time tracking and reporting to monitor business performance.
5. Interactive Features and User Experience:
* Incorporation of interactive features such as filters, drill-downs, and dynamic charts.
* Focus on intuitive user experience to enable easy navigation and data exploration.
6. Testing and Quality Assurance:
* Comprehensive testing to ensure accuracy, functionality, and performance.
* Feedback incorporation and iterative improvements based on your input.
Arthur's other services
Starting at$100
Duration1 week
Tags
Microsoft Power BI
Tableau
Data Analyst
Data Scientist
Data Visualizer
Service provided by
Arthur Rincon de Freitas Arlington, USA
Creative and clean Dashboards to brig your data to life. Arthur Rincon de Freitas
Starting at$100
Duration1 week
Tags
Microsoft Power BI
Tableau
Data Analyst
Data Scientist
Data Visualizer
I offer custom interactive dashboards and data visualization solutions that transform complex data into clear, actionable insights. Utilizing top tools like Tableau and Power BI, I ensure user-friendly designs tailored to your specific business needs. My unique approach combines a deep understanding of data with a focus on intuitive user experience, ensuring that your team can easily navigate and leverage the insights for strategic decision-making.
What's included
Custom Interactive Dashboards and Data Visualization Solutions
1. Initial Consultation and Requirement Analysis:
* One-on-one consultation to understand your business needs, goals, and data sources.
* Detailed requirement gathering and documentation to ensure alignment with your objectives.
2. Data Integration and Preparation:
* Collection and integration of data from various sources (e.g., databases, spreadsheets, APIs).
* Data cleaning, transformation, and preparation to ensure accuracy and consistency.
3. Dashboard Design and Development:
* Custom-designed dashboards tailored to your specific needs and preferences.
* Development of interactive and user-friendly visualizations using tools like Tableau, Power BI, or Google Data Studio.
4. Key Performance Indicators (KPIs) and Metrics Setup:
* Identification and implementation of relevant KPIs and metrics.
* Real-time tracking and reporting to monitor business performance.
5. Interactive Features and User Experience:
* Incorporation of interactive features such as filters, drill-downs, and dynamic charts.
* Focus on intuitive user experience to enable easy navigation and data exploration.
6. Testing and Quality Assurance:
* Comprehensive testing to ensure accuracy, functionality, and performance.
* Feedback incorporation and iterative improvements based on your input.
Arthur's other services
$100