
Microsoft Excel & Power BI Automation Sheet + DashbaordMohamed Shoeib
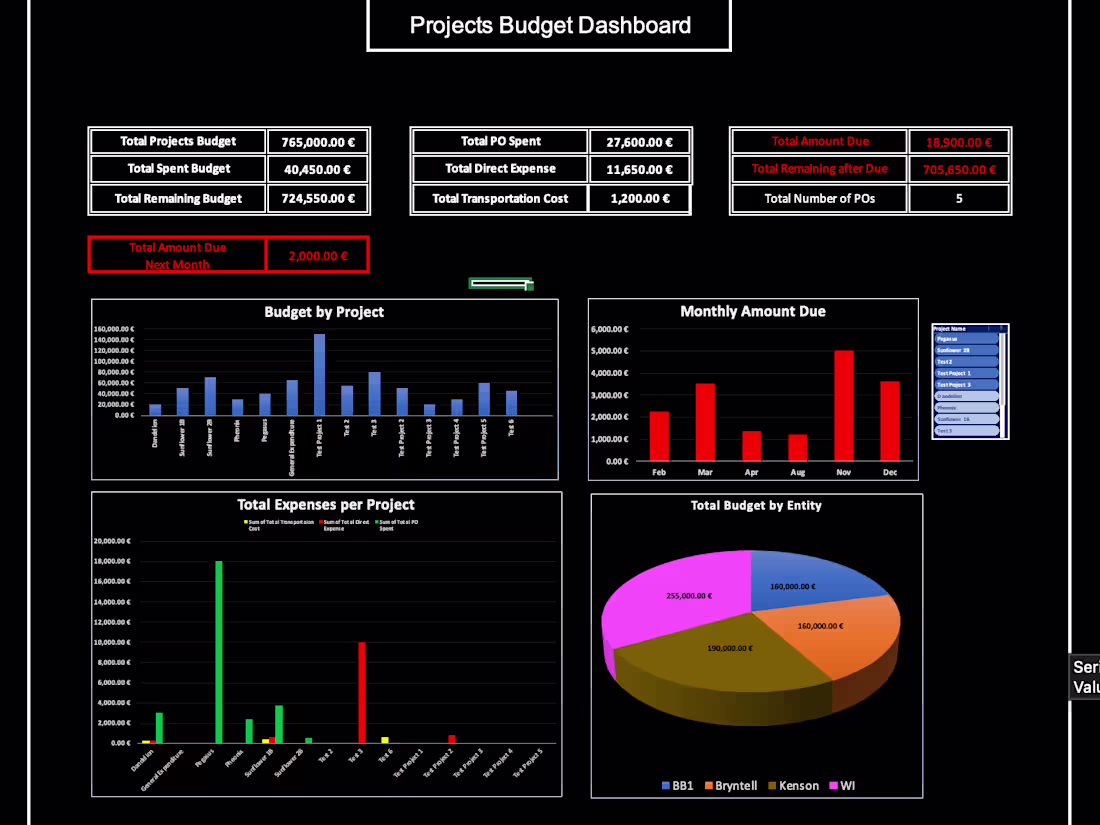
I developed an automated budgeting system in Excel with a structured Master Budget sheet, PO Tracker, and Transactions log. The model calculates all financial metrics automatically, including spend, remaining budget, expenses, and upcoming due payments. I also designed a dynamic dashboard with KPIs and charts to visualize project budgets and spending trends, giving the client accurate and real-time financial visibility.
What's included
Automated Excel Sheets
Used SUMIFS, COUNTIFS, AGGREGATE,PIVOT TABLES, and much more to link excel sheets and make the automated
Data Cleaning
Accurate data and organized to be used for dashboards
Data Visualization
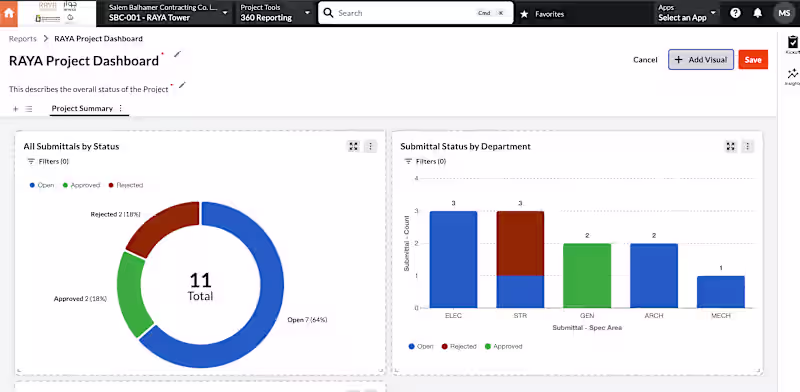
used Power BI to Visualize the Data
Mohamed's other services
Starting at$250
Duration3 days
Tags
D3.js
Matplotlib
Tableau
TensorFlow
three.js
Data Analyst
Data Scientist
Data Visualizer
Service provided by
Mohamed Shoeib Cairo, Egypt
- 5.00
- Rating
- 23
- Followers
Microsoft Excel & Power BI Automation Sheet + DashbaordMohamed Shoeib
Starting at$250
Duration3 days
Tags
D3.js
Matplotlib
Tableau
TensorFlow
three.js
Data Analyst
Data Scientist
Data Visualizer
I developed an automated budgeting system in Excel with a structured Master Budget sheet, PO Tracker, and Transactions log. The model calculates all financial metrics automatically, including spend, remaining budget, expenses, and upcoming due payments. I also designed a dynamic dashboard with KPIs and charts to visualize project budgets and spending trends, giving the client accurate and real-time financial visibility.
What's included
Automated Excel Sheets
Used SUMIFS, COUNTIFS, AGGREGATE,PIVOT TABLES, and much more to link excel sheets and make the automated
Data Cleaning
Accurate data and organized to be used for dashboards
Data Visualization
used Power BI to Visualize the Data
Mohamed's other services
$250