Advanced Excel Data Analysis and visualization

Contact for pricing
About this service
Summary
What's included
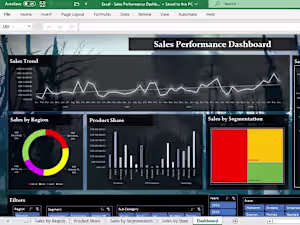
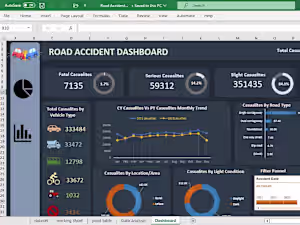
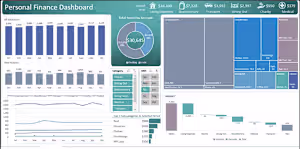
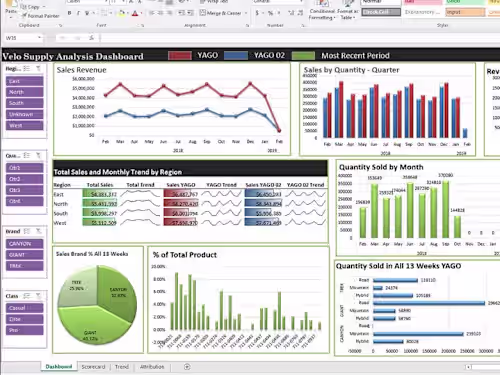
Unleash the Power of Your Data: Advanced Excel Analysis and Visualization
At the end of the project, you can expect: 🌟 Clean and organized data: A well-structured Excel workbook with consistent formatting and data validation rules for improved accuracy. 🔍 In-depth analysis: Comprehensive reports summarizing key findings, insights, and data relationships using pivot tables, advanced formulas (e.g., VLOOKUP, INDEX MATCH), and data analysis tools (e.g., Power Query). 📊 Interactive dashboards: Eye-catching and informative dashboards created with charts, graphs, and sparklines to present complex data in a clear and concise manner. 🎨 Customizable reports: Easily adaptable reports tailored to your specific needs and preferences, allowing you to drill down into specific data points for further exploration. 💡 Enhanced decision-making: Data-driven recommendations and visualizations to empower you to make informed decisions and achieve your business goals.
Example projects