
Business Performance VisualizationGurv Bhogal
Are you using multiple apps to run your business? Does it take forever to get the information or reports you need to see how your business is performing in real-time? I can connect all the data into reports that make sense at a glance. From social media campaigns to Amazon Fulfillment programs, all your data in one place. I can make your business information make more sense and relevant to making the right business decisions. For example:
• Social media campaign results from various platforms for a marketing initiative (FB, Insta, Google, etc.)
• Sales orders and warehouse fulfillment metrics (Inventory, Amazon FBA, Shopify)
• Product performance (Best to worst selling)
• Activity based profit & loss
• Human resources (staffing, salaries, locations, etc.)
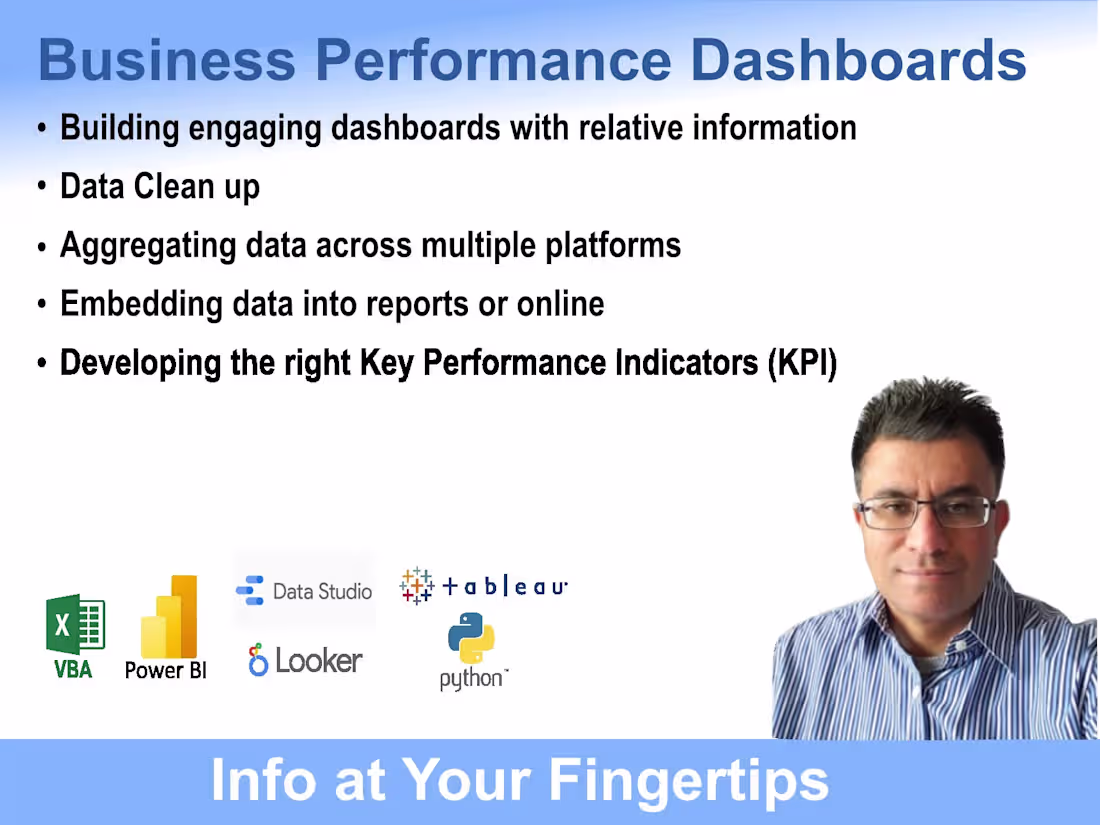
I can clean up data with Excel, VBA or Python before being used in the reports or connect directly. Reports will be created mainly in Microsoft Power BI, Google Looker, Tableau or Excel. Other platforms are available depending on your business needs. Having a dashboard at your fingertips with all the information will allow you to keep growing.
Note: Please contact me before you place your order to ensure I can be of assistance.
What's included
Evaluate Current Reporting Needs
Review the online and offline platforms used to operate the business. Evaluate the required reporting for overall business performance KPIs.
Develop Visual Dashboards
Create the required visual dashboards to monitor the business performance from various aspects such as marketing, sales and operations.
Gurv's other services

Starting at$50 /hr
Tags
Looker
Microsoft Excel
Microsoft Power BI
Python
Data Analyst
Data Scientist
Data Visualizer
Service provided by
Gurv Bhogal Toronto, Canada
Business Performance VisualizationGurv Bhogal
Starting at$50 /hr
Tags
Looker
Microsoft Excel
Microsoft Power BI
Python
Data Analyst
Data Scientist
Data Visualizer
Are you using multiple apps to run your business? Does it take forever to get the information or reports you need to see how your business is performing in real-time? I can connect all the data into reports that make sense at a glance. From social media campaigns to Amazon Fulfillment programs, all your data in one place. I can make your business information make more sense and relevant to making the right business decisions. For example:
• Social media campaign results from various platforms for a marketing initiative (FB, Insta, Google, etc.)
• Sales orders and warehouse fulfillment metrics (Inventory, Amazon FBA, Shopify)
• Product performance (Best to worst selling)
• Activity based profit & loss
• Human resources (staffing, salaries, locations, etc.)
I can clean up data with Excel, VBA or Python before being used in the reports or connect directly. Reports will be created mainly in Microsoft Power BI, Google Looker, Tableau or Excel. Other platforms are available depending on your business needs. Having a dashboard at your fingertips with all the information will allow you to keep growing.
Note: Please contact me before you place your order to ensure I can be of assistance.
What's included
Evaluate Current Reporting Needs
Review the online and offline platforms used to operate the business. Evaluate the required reporting for overall business performance KPIs.
Develop Visual Dashboards
Create the required visual dashboards to monitor the business performance from various aspects such as marketing, sales and operations.
Gurv's other services
$50 /hr