
Data Visualization Dashboard Using StreamlitMohsen M
I offer custom-built, interactive data visualization dashboards that transform complex data into clear, actionable insights. Leveraging my expertise in data science and machine learning, I create intuitive, powerful tools that enable you to explore your data effortlessly and make informed decisions. My unique approach combines cutting-edge visualization techniques with advanced analytics, ensuring your dashboard not only presents data beautifully but also uncovers hidden patterns and trends that drive business value.
What's included
Interactive Data Visualization Dashboard
Transform your raw data into actionable insights with a custom-built, interactive data visualization dashboard. As an experienced data scientist and visualization expert, I deliver comprehensive solutions that empower you to explore your data effortlessly and make informed decisions.
Deliverables:
1. Custom Dashboard Application: A fully functional, interactive dashboard tailored to your specific data and business needs.
2. Data Integration and Preprocessing: Cleaned and structured datasets ready for visualization.
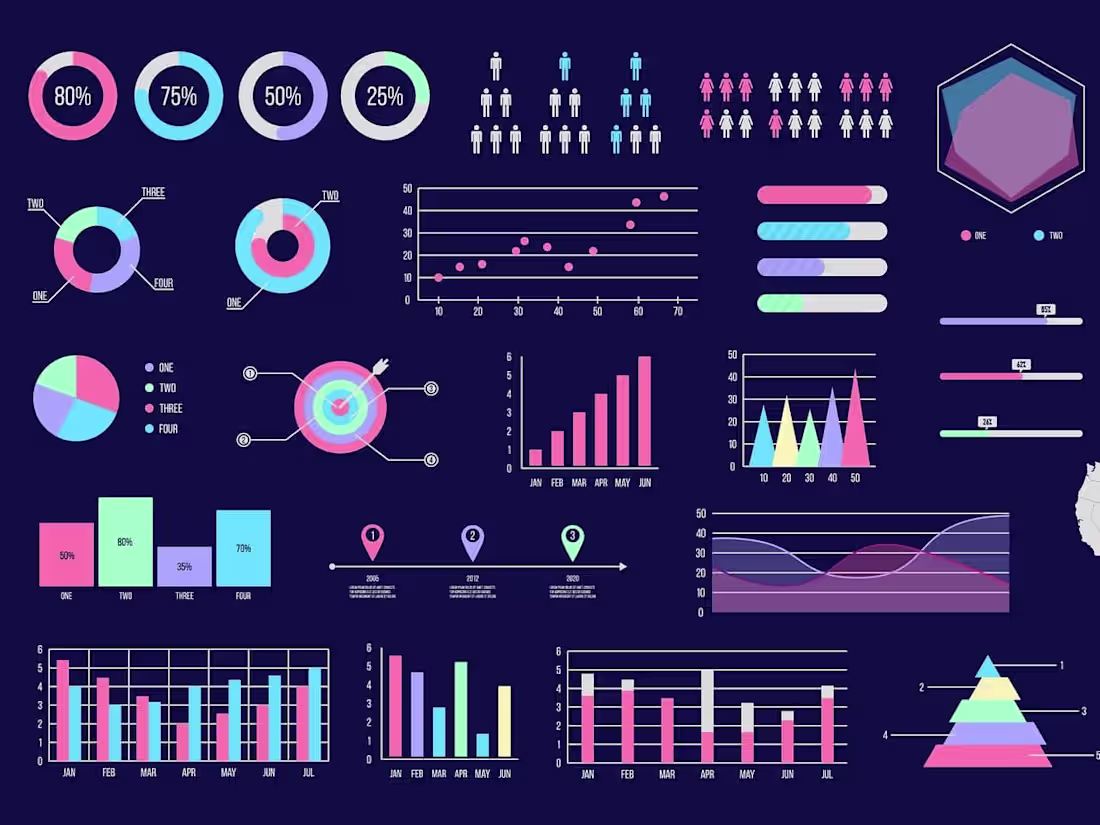
3. Multiple Visualization Types: A variety of charts, graphs, and maps as appropriate for your data (e.g., line charts, bar graphs, heatmaps, geographic visualizations).
4. Interactive Features: Filters, drill-down capabilities, and dynamic updates for in-depth data exploration.
5. Responsive Design: Dashboard optimized for both desktop and mobile viewing.
6. Performance Optimization: Ensuring smooth performance even with large datasets.
7. User Guide: Comprehensive documentation on how to use and interpret the dashboard.
8. Source Code: Well-commented code for the dashboard application.
9. Deployment Instructions: Step-by-step guide for deploying the dashboard on your preferred platform.
10. Training Session: A virtual session to walk your team through the dashboard's features and capabilities.
Mohsen's other services

Starting at$30 /hr
Tags
Dash Plotly
Matplotlib
PyTorch
seaborn
TensorFlow
Data Analyst
Data Scientist
Data Visualizer
Service provided by
Mohsen M Italy
- 1
- Followers
Data Visualization Dashboard Using StreamlitMohsen M
Starting at$30 /hr
Tags
Dash Plotly
Matplotlib
PyTorch
seaborn
TensorFlow
Data Analyst
Data Scientist
Data Visualizer
I offer custom-built, interactive data visualization dashboards that transform complex data into clear, actionable insights. Leveraging my expertise in data science and machine learning, I create intuitive, powerful tools that enable you to explore your data effortlessly and make informed decisions. My unique approach combines cutting-edge visualization techniques with advanced analytics, ensuring your dashboard not only presents data beautifully but also uncovers hidden patterns and trends that drive business value.
What's included
Interactive Data Visualization Dashboard
Transform your raw data into actionable insights with a custom-built, interactive data visualization dashboard. As an experienced data scientist and visualization expert, I deliver comprehensive solutions that empower you to explore your data effortlessly and make informed decisions.
Deliverables:
1. Custom Dashboard Application: A fully functional, interactive dashboard tailored to your specific data and business needs.
2. Data Integration and Preprocessing: Cleaned and structured datasets ready for visualization.
3. Multiple Visualization Types: A variety of charts, graphs, and maps as appropriate for your data (e.g., line charts, bar graphs, heatmaps, geographic visualizations).
4. Interactive Features: Filters, drill-down capabilities, and dynamic updates for in-depth data exploration.
5. Responsive Design: Dashboard optimized for both desktop and mobile viewing.
6. Performance Optimization: Ensuring smooth performance even with large datasets.
7. User Guide: Comprehensive documentation on how to use and interpret the dashboard.
8. Source Code: Well-commented code for the dashboard application.
9. Deployment Instructions: Step-by-step guide for deploying the dashboard on your preferred platform.
10. Training Session: A virtual session to walk your team through the dashboard's features and capabilities.
Mohsen's other services
$30 /hr