
Data Visualizations in Tableau / PowerBI / Excel Bradley Colson
I'm an aspiring dad analyst looking for freelance work.
Since I'm new I'm offering a very low project rate.
I will do unlimited revisions for free.
I'm offering a 100% refund if you are unsatisfied with the visualization for any reason.
There is 100% no risk for you to hire me.
What's included
Dashboard created showcasing the metrics client requests
Who create a dashboard in Excel, Tableau, or Power BI to display key insights for metrics the client requests.
FAQs
I'll edit as much as needed for no extra cost.
I'll refund your payment 100% There is zero risk to hire me.
No, I'm a help desk remote tech that is actively learning and creating project visualizations in order to get a gig or job in data analytics.
This means I'm 100% excited for a client and 100% focused on client satisfaction.
Ideally within 3 days but likely much sooner. It depends on the size of your project.
I'm studying and practicing data analytics as my side hustle. I need real world work more than I need a high hourly rate.
You can find my practice data analytics portfolio at both https://bradleycolson.carrd.co/# and https://github.com/BradleyColson
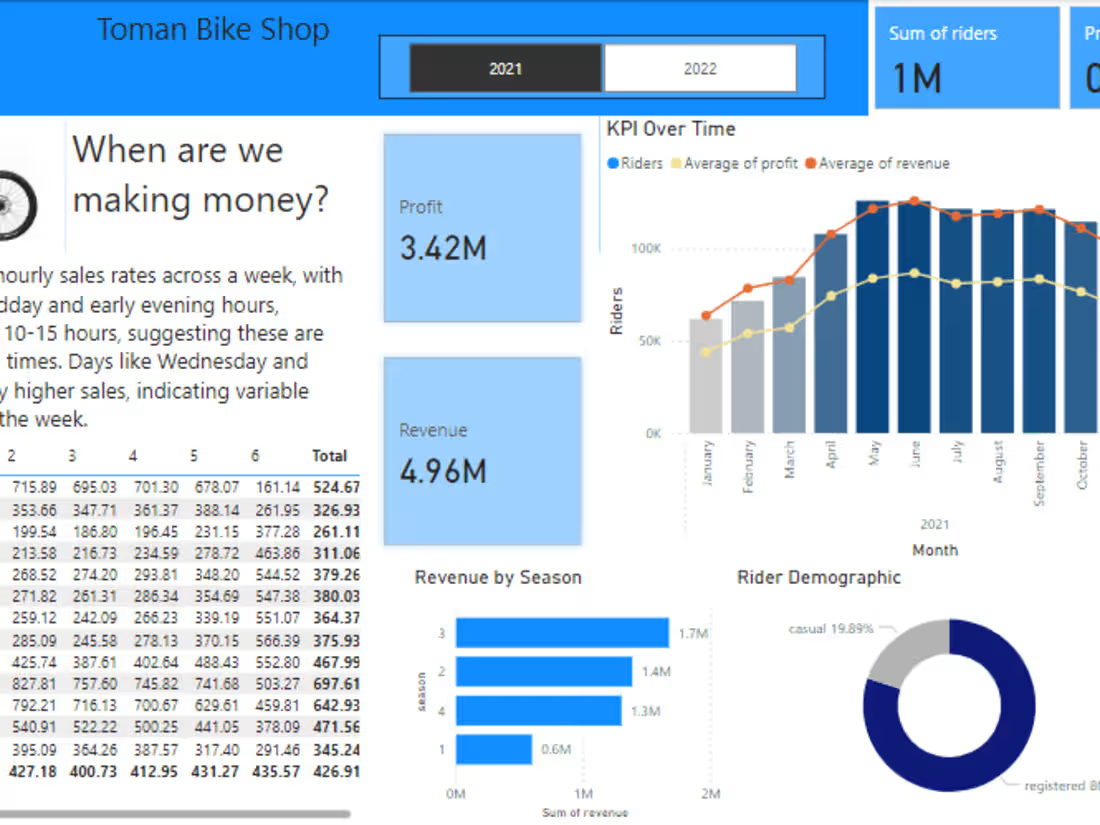
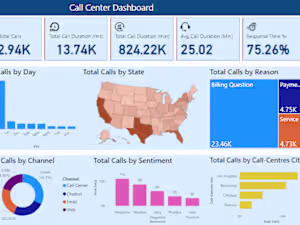
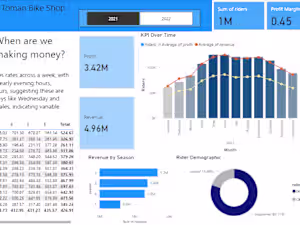
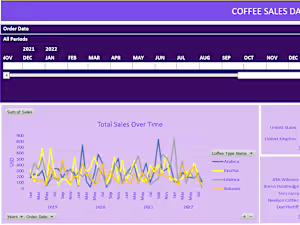
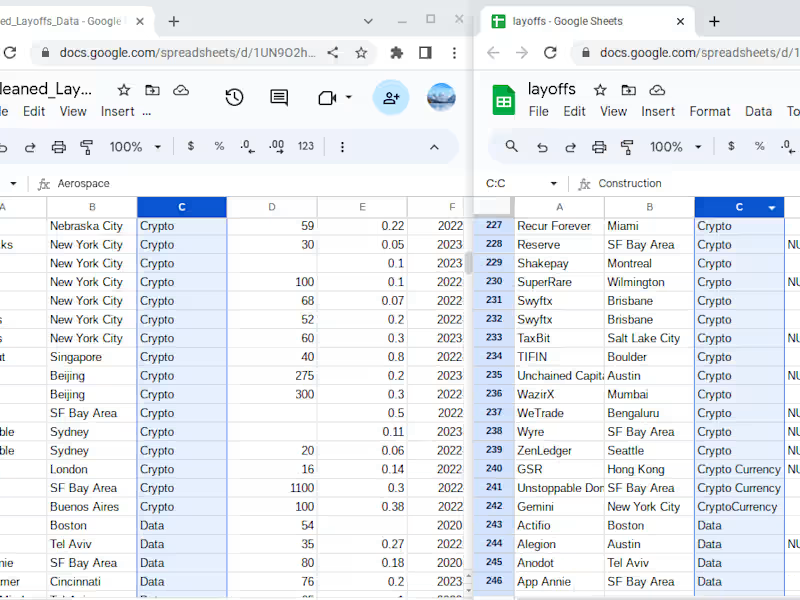
Example work

Bradley's other services
Starting at$5
Duration3 days
Tags
D3.js


Matplotlib

Tableau

TensorFlow

three.js

Data Analyst
Data Scientist
Data Visualizer
Service provided by
Bradley Colson New York, USA
Data Visualizations in Tableau / PowerBI / Excel Bradley Colson
Starting at$5
Duration3 days
Tags
D3.js
Matplotlib
Tableau
TensorFlow
three.js
Data Analyst
Data Scientist
Data Visualizer
I'm an aspiring dad analyst looking for freelance work.
Since I'm new I'm offering a very low project rate.
I will do unlimited revisions for free.
I'm offering a 100% refund if you are unsatisfied with the visualization for any reason.
There is 100% no risk for you to hire me.
What's included
Dashboard created showcasing the metrics client requests
Who create a dashboard in Excel, Tableau, or Power BI to display key insights for metrics the client requests.
FAQs
I'll edit as much as needed for no extra cost.
I'll refund your payment 100% There is zero risk to hire me.
No, I'm a help desk remote tech that is actively learning and creating project visualizations in order to get a gig or job in data analytics.
This means I'm 100% excited for a client and 100% focused on client satisfaction.
Ideally within 3 days but likely much sooner. It depends on the size of your project.
I'm studying and practicing data analytics as my side hustle. I need real world work more than I need a high hourly rate.
You can find my practice data analytics portfolio at both https://bradleycolson.carrd.co/# and https://github.com/BradleyColson
Example work
Bradley's other services
$5