I create interactive dashboards and reportsJosiah Nyamai
I ensure you have a clear understanding of the project objectives and scope, followed by thorough data collection and cleaning processes. Conduct exploratory data analysis to uncover patterns and insights, then apply appropriate statistical deeper analysis. Present your findings using visualizations and descriptive summaries, interpreting the results to derive actionable insights and recommendations. Validate your analysis through sensitivity testing and address any limitations or challenges encountered during the process. Finally, summarize the key findings and conclusions in a concise and impactful manner, providing value and actionable intelligence to stakeholders.
What's included
Data Analysis Report
This is a comprehensive document that outlines the analysis process, including data cleaning, exploratory data analysis (EDA), statistical tests, modeling techniques (if applicable), and interpretation of results. It should include visualizations like charts, graphs, and tables to present the findings clearly.
Data Visualizations
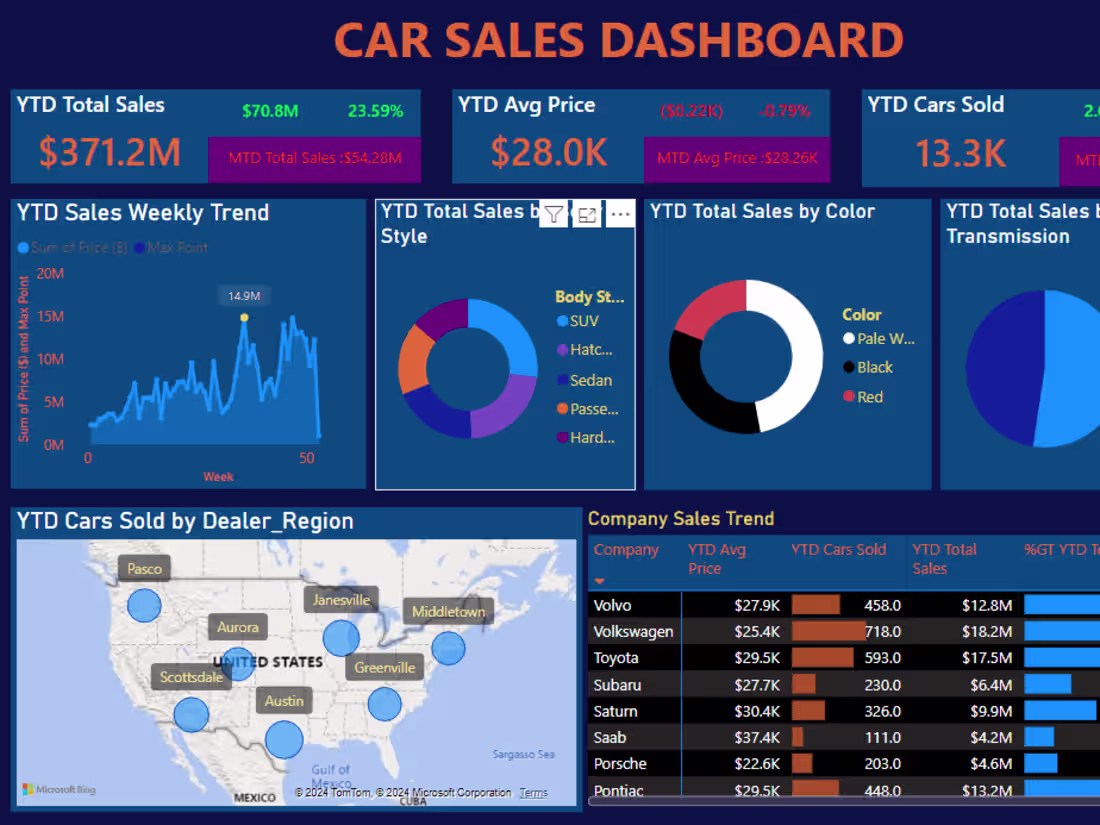
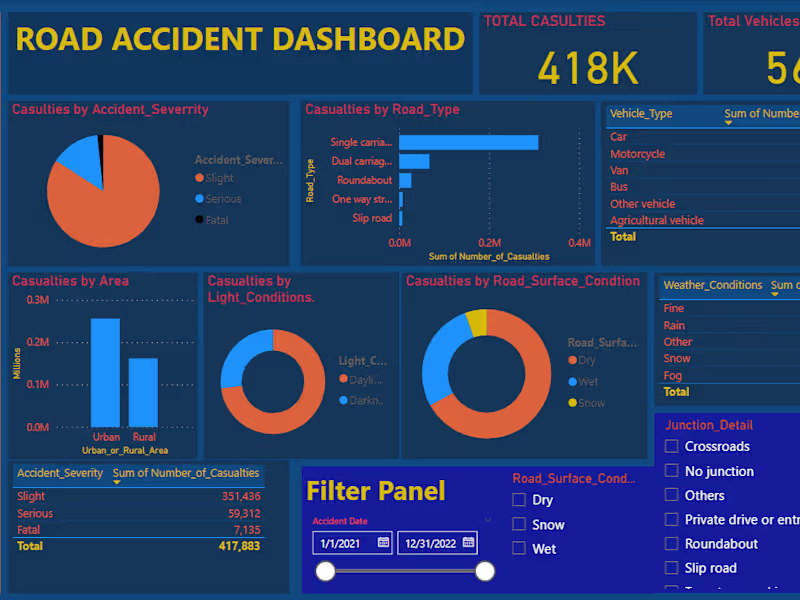
Create visualizations such as charts, dashboards, and infographics to visually represent the data trends, patterns, and key findings. Visualizations are often easier for clients to understand and can convey complex information effectively.
Josiah's other services
Starting at$20
Duration1 week
Tags
Jupyter
Microsoft Excel
Microsoft Power BI
Python
Tableau
Data Analyst
Data Visualizer
Service provided by
Josiah Nyamai Nairobi, Kenya
I create interactive dashboards and reportsJosiah Nyamai
Starting at$20
Duration1 week
Tags
Jupyter
Microsoft Excel
Microsoft Power BI
Python
Tableau
Data Analyst
Data Visualizer
I ensure you have a clear understanding of the project objectives and scope, followed by thorough data collection and cleaning processes. Conduct exploratory data analysis to uncover patterns and insights, then apply appropriate statistical deeper analysis. Present your findings using visualizations and descriptive summaries, interpreting the results to derive actionable insights and recommendations. Validate your analysis through sensitivity testing and address any limitations or challenges encountered during the process. Finally, summarize the key findings and conclusions in a concise and impactful manner, providing value and actionable intelligence to stakeholders.
What's included
Data Analysis Report
This is a comprehensive document that outlines the analysis process, including data cleaning, exploratory data analysis (EDA), statistical tests, modeling techniques (if applicable), and interpretation of results. It should include visualizations like charts, graphs, and tables to present the findings clearly.
Data Visualizations
Create visualizations such as charts, dashboards, and infographics to visually represent the data trends, patterns, and key findings. Visualizations are often easier for clients to understand and can convey complex information effectively.
Josiah's other services
$20