
Interactive Excel/ Power Bi Dashboards That Drive DecisionsOboh Freedom
I build clean, fast, and fully interactive Excel & Power BI dashboards that turn raw data into clear business answers in seconds, no more scrolling through endless Excel sheets or confusing charts.
What makes me different: I combine strong data modeling skills with a sharp eye for design, so your dashboards are not only work perfectly on desktop and mobile, but actually get used daily by your entire team.
Based in Lagos, always online, and obsessed with delivering insights that directly improve performance and drive growth.
What's included
Interactive Power BI Dashboards That Your Team Will Actually Use Daily
I turn raw, messy data into stunning, fast, and fully interactive Power BI dashboards. Perfect for sales tracking, marketing performance, operations, finance, or executive reporting.
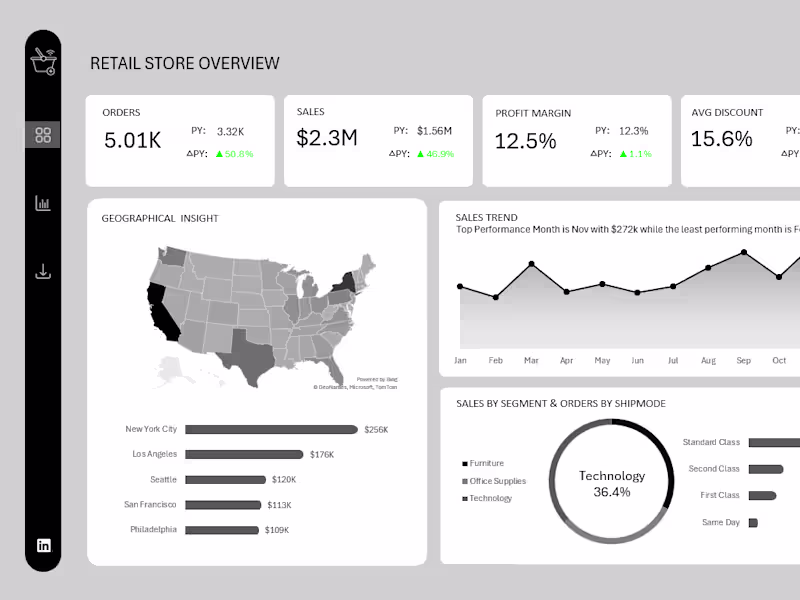
Published Power BI Dashboard
Fully interactive .pbix file + published to your Power BI workspace
Live Shareable Link
Connected & Cleaned Data Model
All data sources connected, transformed, and optimized with Power Query
1-4 Interactive Report Pages
Custom layout with KPIs, charts, slicers, drill-downs, and tooltips
5-10Minute Recorded Walkthrough
2 Rounds of Revisions Included
We keep tweaking until you love it
Rock-Solid Excel Dashboards, Models & Full Automation (Zero Manual Work)
Stop wasting hours on copy-paste and broken formulas every month. I build you a bulletproof, automated Excel system that updates itself and looks beautiful.
Master Excel Workbook - Single, organized .xlsx file with everything inside
Fully Automated Data Refresh- Pulls new data automatically via Power Query or macros
Dynamic Interactive Dashboard- Slicers, pivot charts, conditional formatting, and drill-downs
Custom VBA Macros (if needed)- Buttons and macros that run your processes with one click
Clean & Documented Formulas- Every formula explained + error-proof design
5-10Minute Recorded Walkthrough
2 Rounds of Revisions Included
We keep tweaking until you love it
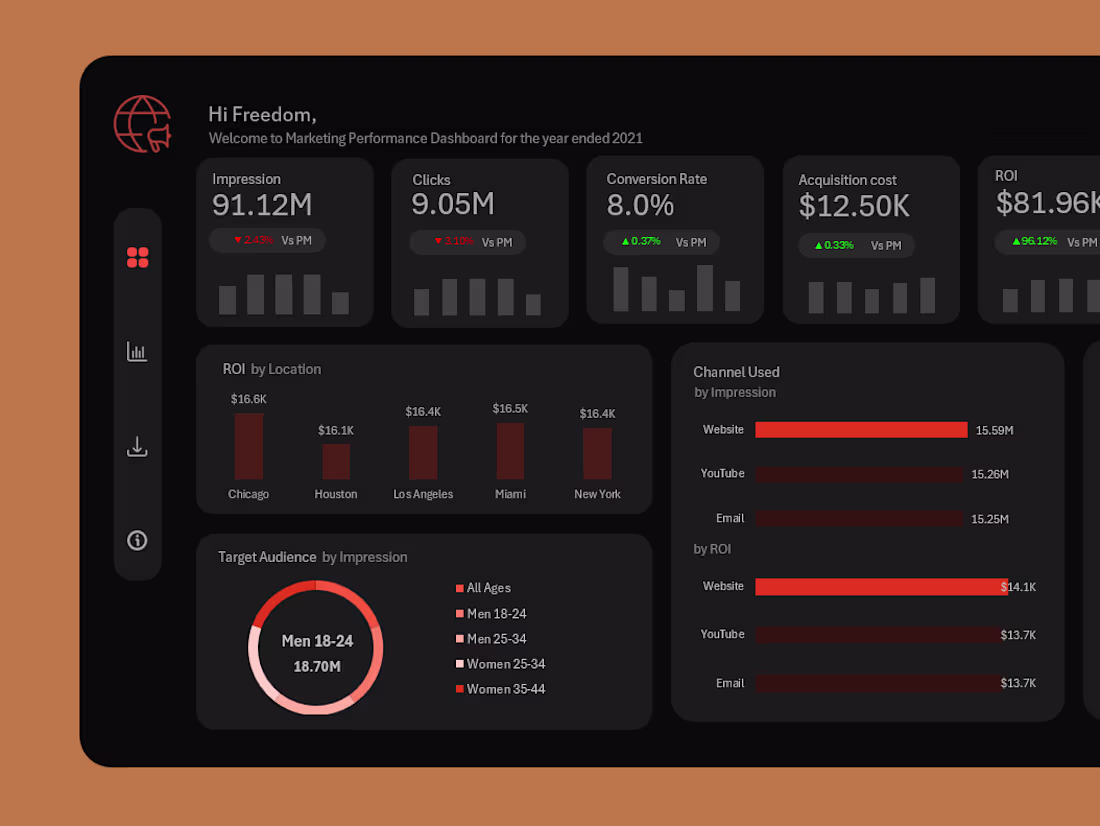
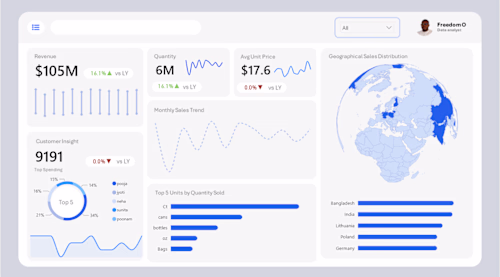
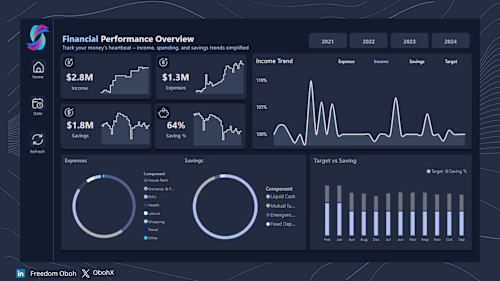
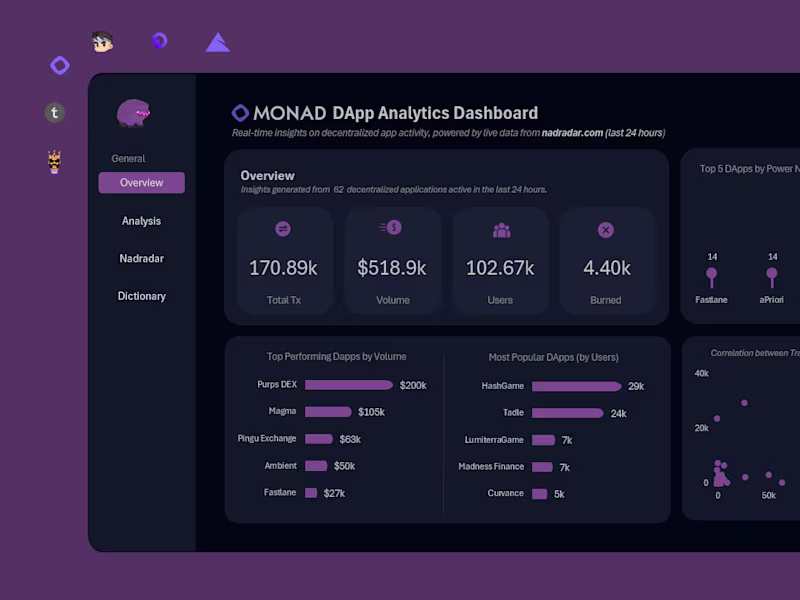
Example work
Starting at$25 /hr
Tags
Excel VBA
Google App Script
Google Sheets
Microsoft Excel
Microsoft Power BI
Data Analyst
Data Scientist
Data Visualizer
Service provided by
Oboh Freedom Lagos, Nigeria
- 5
- Followers
Interactive Excel/ Power Bi Dashboards That Drive DecisionsOboh Freedom
Starting at$25 /hr
Tags
Excel VBA
Google App Script
Google Sheets
Microsoft Excel
Microsoft Power BI
Data Analyst
Data Scientist
Data Visualizer
I build clean, fast, and fully interactive Excel & Power BI dashboards that turn raw data into clear business answers in seconds, no more scrolling through endless Excel sheets or confusing charts.
What makes me different: I combine strong data modeling skills with a sharp eye for design, so your dashboards are not only work perfectly on desktop and mobile, but actually get used daily by your entire team.
Based in Lagos, always online, and obsessed with delivering insights that directly improve performance and drive growth.
What's included
Interactive Power BI Dashboards That Your Team Will Actually Use Daily
I turn raw, messy data into stunning, fast, and fully interactive Power BI dashboards. Perfect for sales tracking, marketing performance, operations, finance, or executive reporting.
Published Power BI Dashboard
Fully interactive .pbix file + published to your Power BI workspace
Live Shareable Link
Connected & Cleaned Data Model
All data sources connected, transformed, and optimized with Power Query
1-4 Interactive Report Pages
Custom layout with KPIs, charts, slicers, drill-downs, and tooltips
5-10Minute Recorded Walkthrough
2 Rounds of Revisions Included
We keep tweaking until you love it
Rock-Solid Excel Dashboards, Models & Full Automation (Zero Manual Work)
Stop wasting hours on copy-paste and broken formulas every month. I build you a bulletproof, automated Excel system that updates itself and looks beautiful.
Master Excel Workbook - Single, organized .xlsx file with everything inside
Fully Automated Data Refresh- Pulls new data automatically via Power Query or macros
Dynamic Interactive Dashboard- Slicers, pivot charts, conditional formatting, and drill-downs
Custom VBA Macros (if needed)- Buttons and macros that run your processes with one click
Clean & Documented Formulas- Every formula explained + error-proof design
5-10Minute Recorded Walkthrough
2 Rounds of Revisions Included
We keep tweaking until you love it
Example work
$25 /hr