
Data Cleaning, Analysis, and Visualize Your Business DataNayeem s
I offer professional data cleaning, analysis, and visualization services to help you turn raw data into actionable insights. Using Python, SQL, Power BI, and Tableau, I ensure your data is accurate, structured, and presented clearly to support data-driven decisions. My attention to detail, quick turnaround, and ability to communicate insights effectively make me a reliable partner for your projects.
What's included
Cleaned Dataset, Data Analysis Report, Data Visualizations
✅ 1. Cleaned Dataset
Fully cleaned and formatted dataset (CSV, Excel, or requested format)
Removal of missing values, duplicates, and outliers as per client instructions
Consistent column naming and structured data ready for analysis
✅ 2. Data Analysis Report
Summary of key findings and insights from the dataset
Descriptive statistics (mean, median, standard deviation, etc.)
Trend and pattern analysis relevant to client business objectives
Delivered as a PDF or Word document
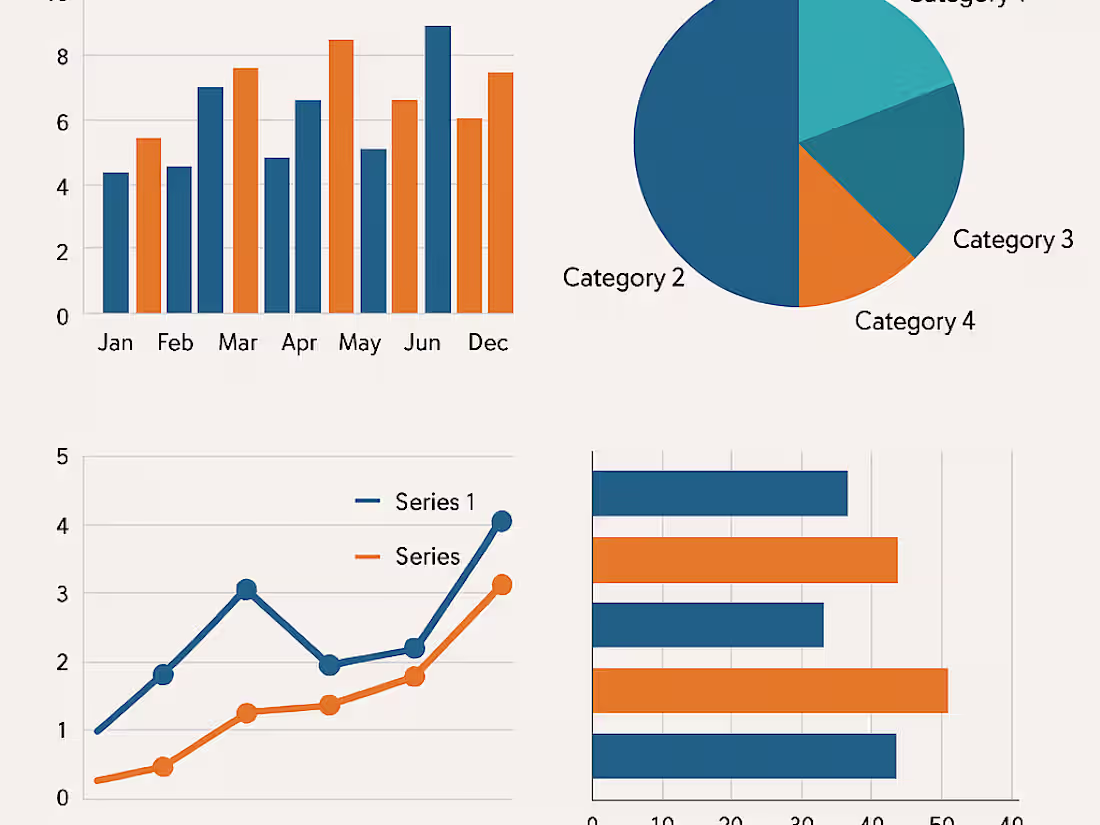
✅ 3. Data Visualizations
Professional charts and graphs (bar charts, pie charts, histograms, line graphs, etc.)
Interactive dashboards (if using Power BI or Tableau)
Clear labeling and explanations for each visualization
Delivered as image files (PNG/JPEG) or shared dashboard links
FAQs
Example work
Nayeem's other services
Starting at$1.11 /hr
Tags
Microsoft Excel
Microsoft Power BI
pandas
Tableau
Data Analyst
Intern
Product Data Analyst
Service provided by
Nayeem s Cuddalore, India
Data Cleaning, Analysis, and Visualize Your Business DataNayeem s
Starting at$1.11 /hr
Tags
Microsoft Excel
Microsoft Power BI
pandas
Tableau
Data Analyst
Intern
Product Data Analyst
I offer professional data cleaning, analysis, and visualization services to help you turn raw data into actionable insights. Using Python, SQL, Power BI, and Tableau, I ensure your data is accurate, structured, and presented clearly to support data-driven decisions. My attention to detail, quick turnaround, and ability to communicate insights effectively make me a reliable partner for your projects.
What's included
Cleaned Dataset, Data Analysis Report, Data Visualizations
✅ 1. Cleaned Dataset
Fully cleaned and formatted dataset (CSV, Excel, or requested format)
Removal of missing values, duplicates, and outliers as per client instructions
Consistent column naming and structured data ready for analysis
✅ 2. Data Analysis Report
Summary of key findings and insights from the dataset
Descriptive statistics (mean, median, standard deviation, etc.)
Trend and pattern analysis relevant to client business objectives
Delivered as a PDF or Word document
✅ 3. Data Visualizations
Professional charts and graphs (bar charts, pie charts, histograms, line graphs, etc.)
Interactive dashboards (if using Power BI or Tableau)
Clear labeling and explanations for each visualization
Delivered as image files (PNG/JPEG) or shared dashboard links
FAQs
Example work
Nayeem's other services
$1.11 /hr